Grafana
Connecting Hawkeye to your Grafana account allows us to collect application and infrastructure telemetry, which includes metrics, traces, and logs. These telemetry data enable real-time monitoring and alerting through the Hawkeye dashboard.
To ensure an easy connection with Hawkeye, you will authenticate using your Grafana Service Account Token.
Step 1: Generate your Service Account Token from Grafana.
Fig.1 - A walkthrough of how to generate service account token in Grafana
-
Log in to Grafana Account: Access your Grafana endpoint by logging in with your credentials.
-
Navigate to Users and Access: On the sidebar menu, navigate to Users and access under Administration tab, and click on Service account card.
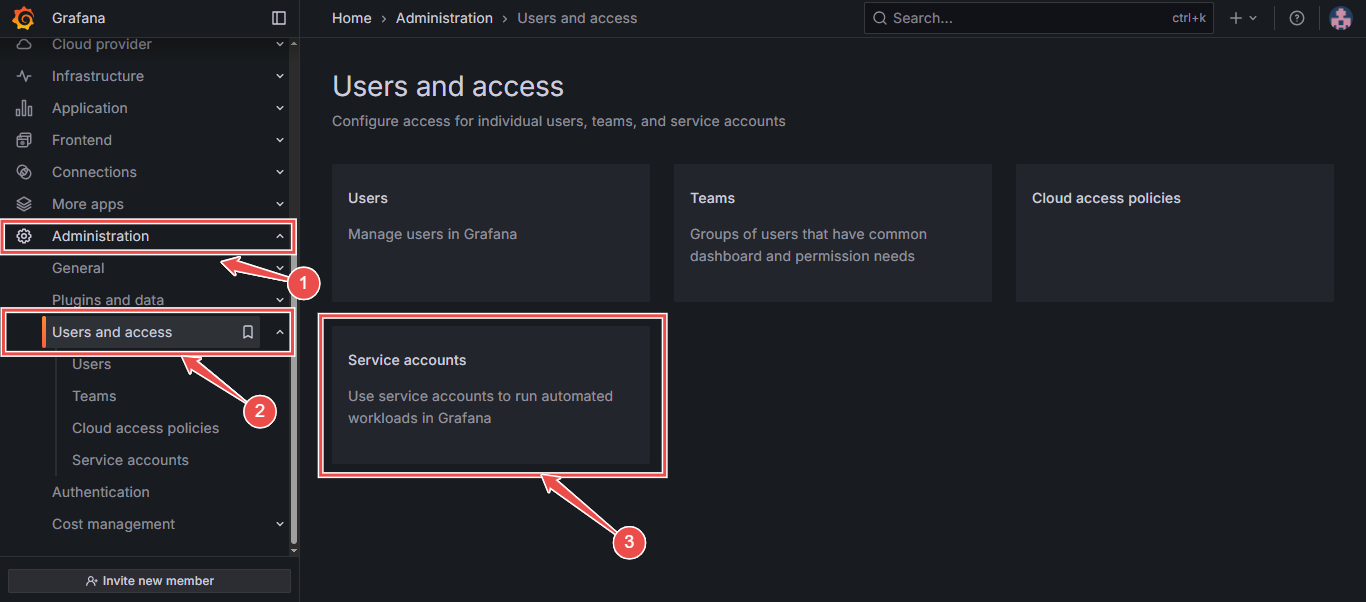
Fig.2 - Grafana users and access
-
Click Add Service Account: At the top-right corner of the Service Accounts page, click on the Add Service Accounts button.
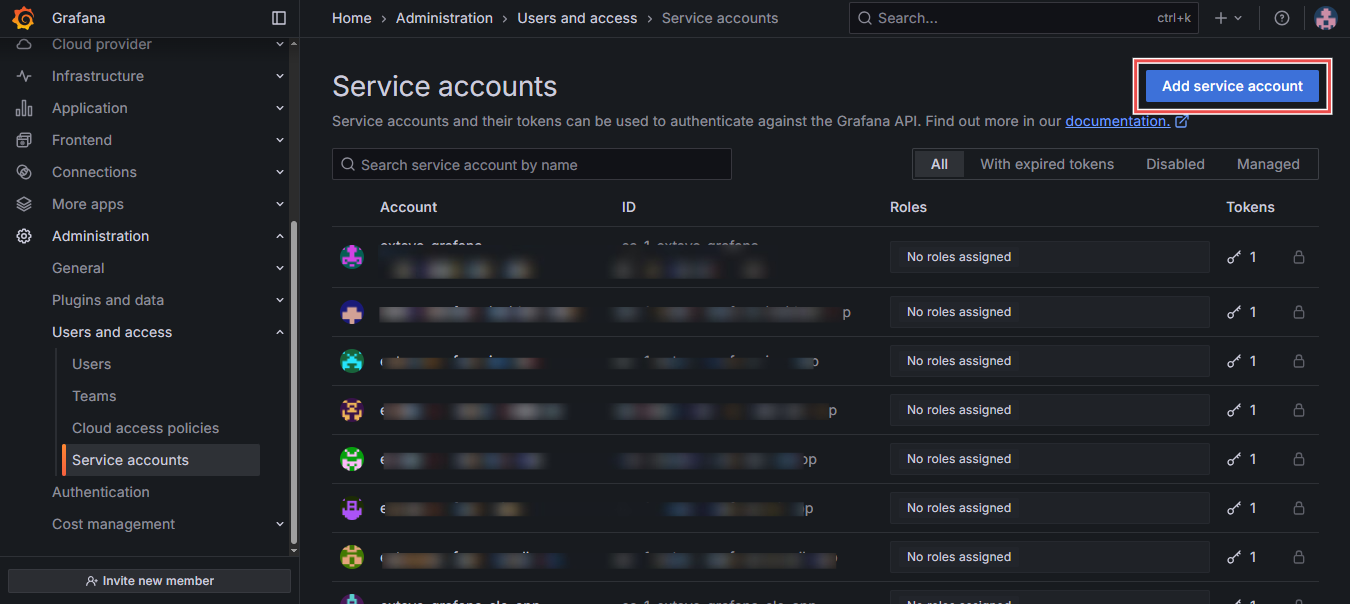
Fig.3 - Grafana service account
-
Enter a display name: In the input box provided, enter a display name and click Create
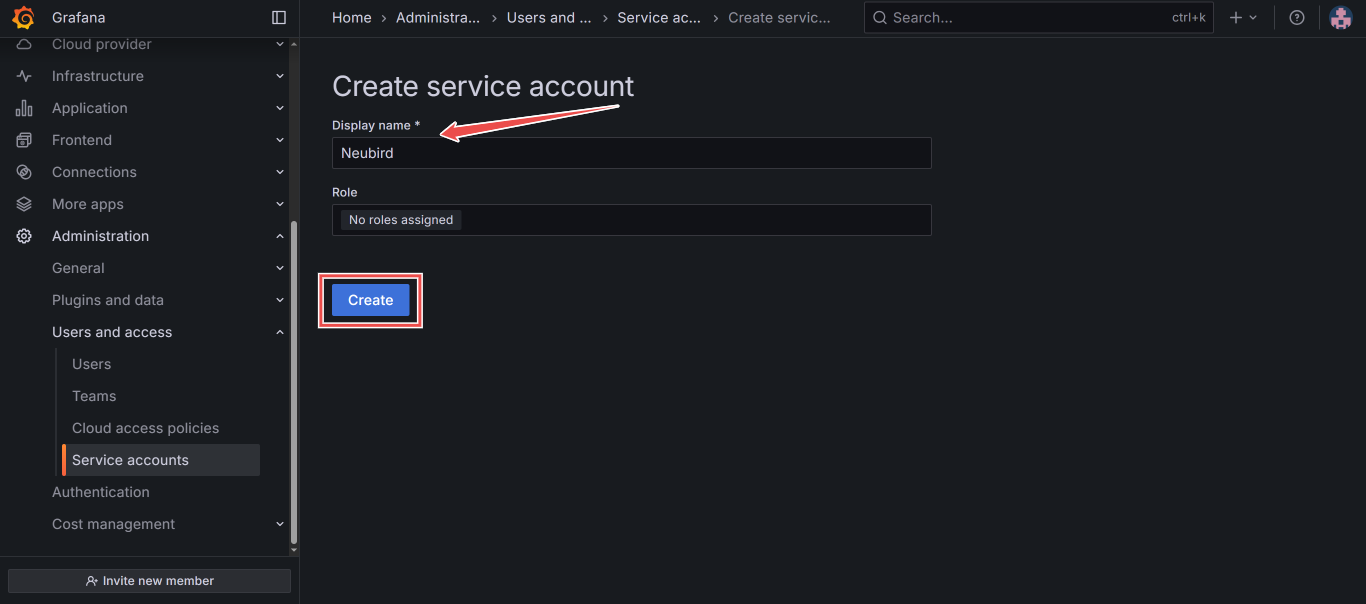
Fig.4 - Grafana service display name
-
Click Add Service Account Token: At the bottom-right corner of the new Service Accounts page, click Add service accounts token
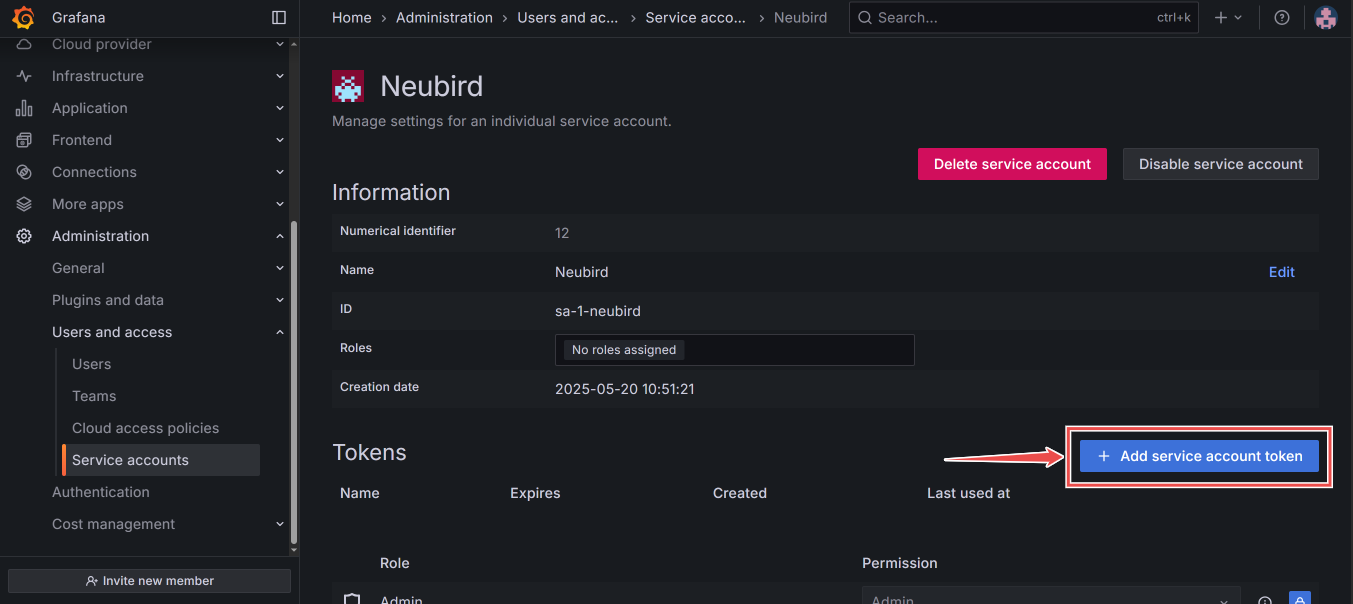
Fig.5 - Grafana service account token
-
Enter token display name: In the input box provided, enter a display name for your token, and click Generate token.
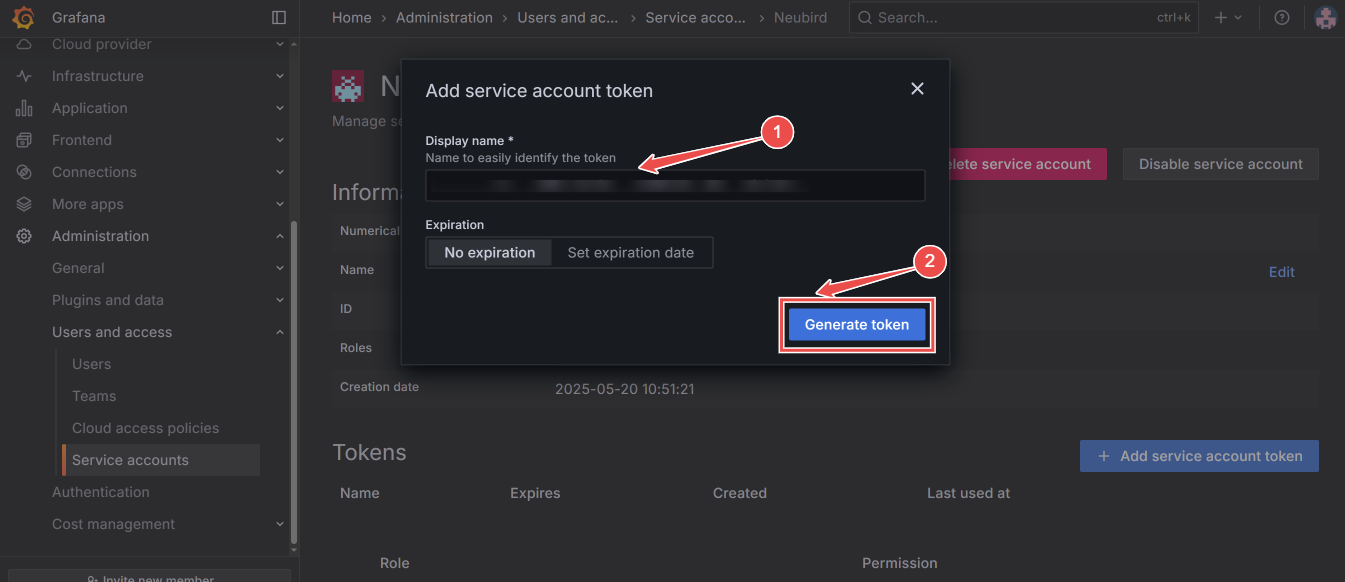
Fig.6 - Generate token
-
Copy token: Your new Service account token has been created, copy and safe your token securely.
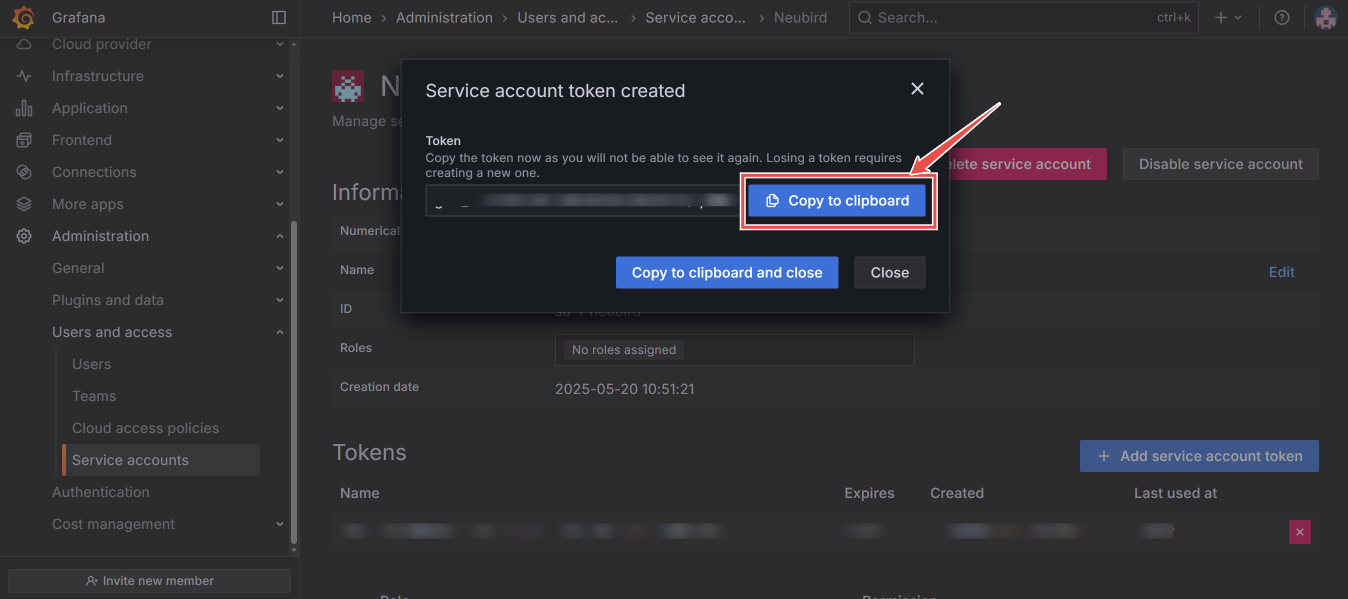
Fig.7 - Copy service account token
Step 2: Add Grafana Connection to Hawkeye
Fig.8 - A walkthrough of how to add Grafana connection to Hawkeye
-
Navigate to the Connections Tab: In the Hawkeye dashboard, go to the Connections section and click on New Connection.
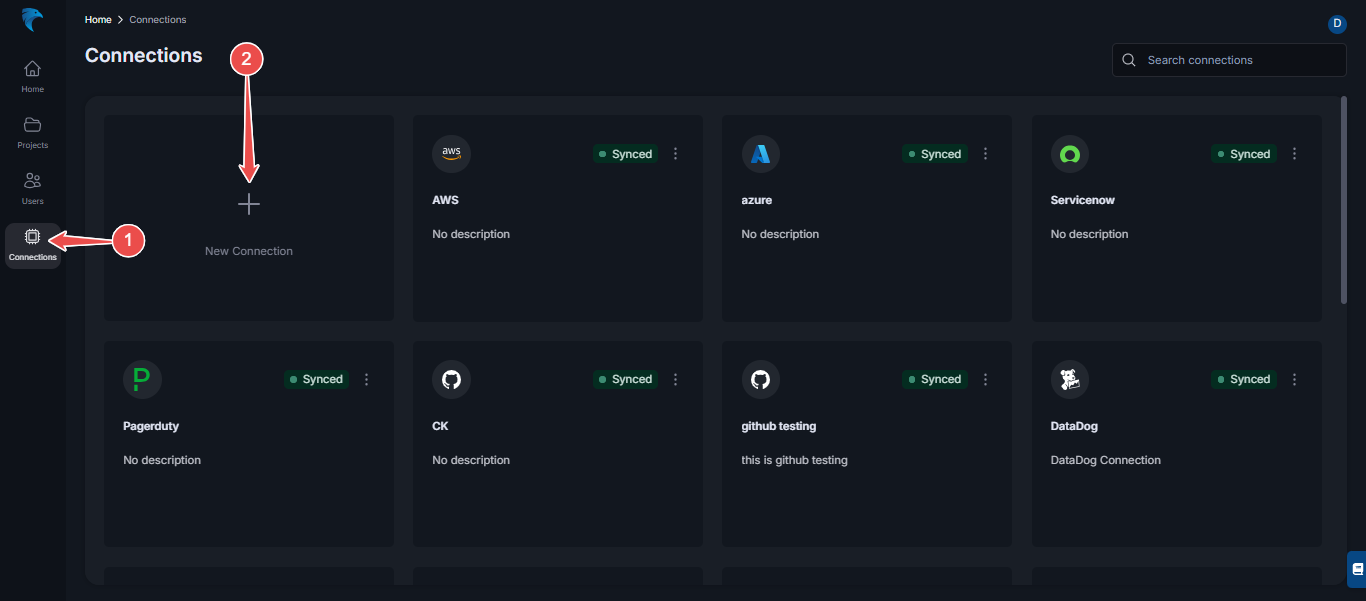
Fig.9 - Grafana new connection
-
Select Grafana: From the list of available integrations, select Grafana.
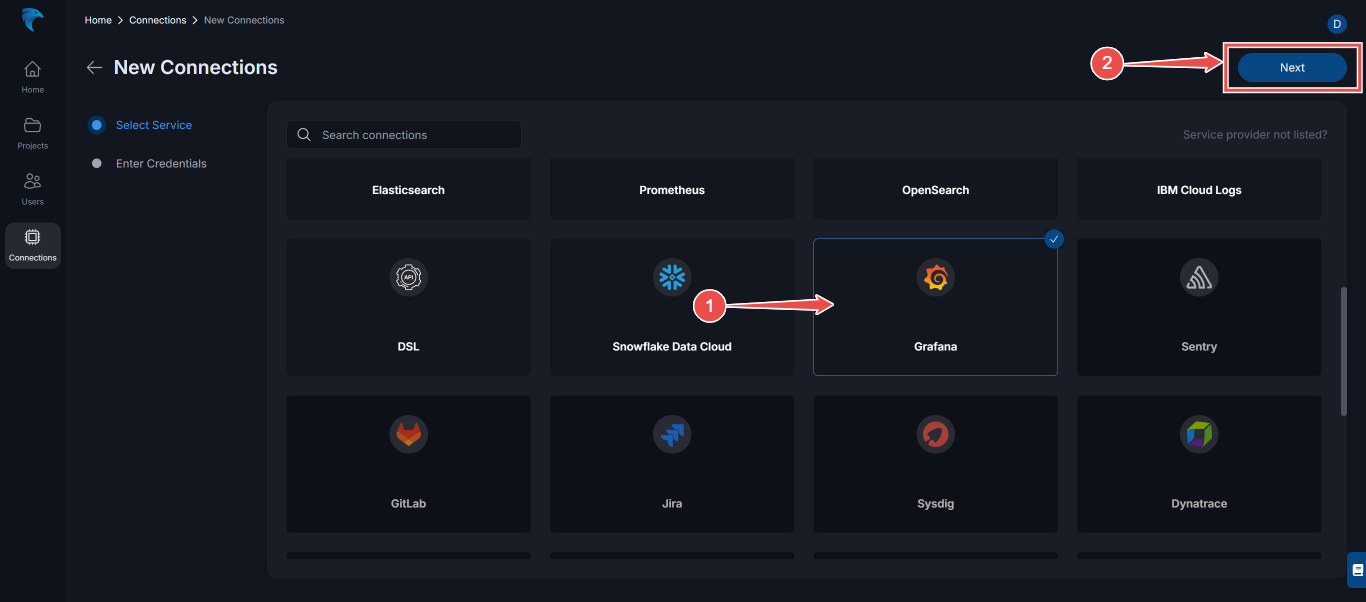
Fig.10 - Select Grafana
Then, click Next at the top right corner.
-
Enter Credentials: Provide the following credentials:
- Name: Give your connection a descriptive name.
- Description: Optionally, add a description for the integration.
- Endpoint: Enter your Grafana instance from your browser.
- Token: Enter the service account token you generated from your Grafana account.
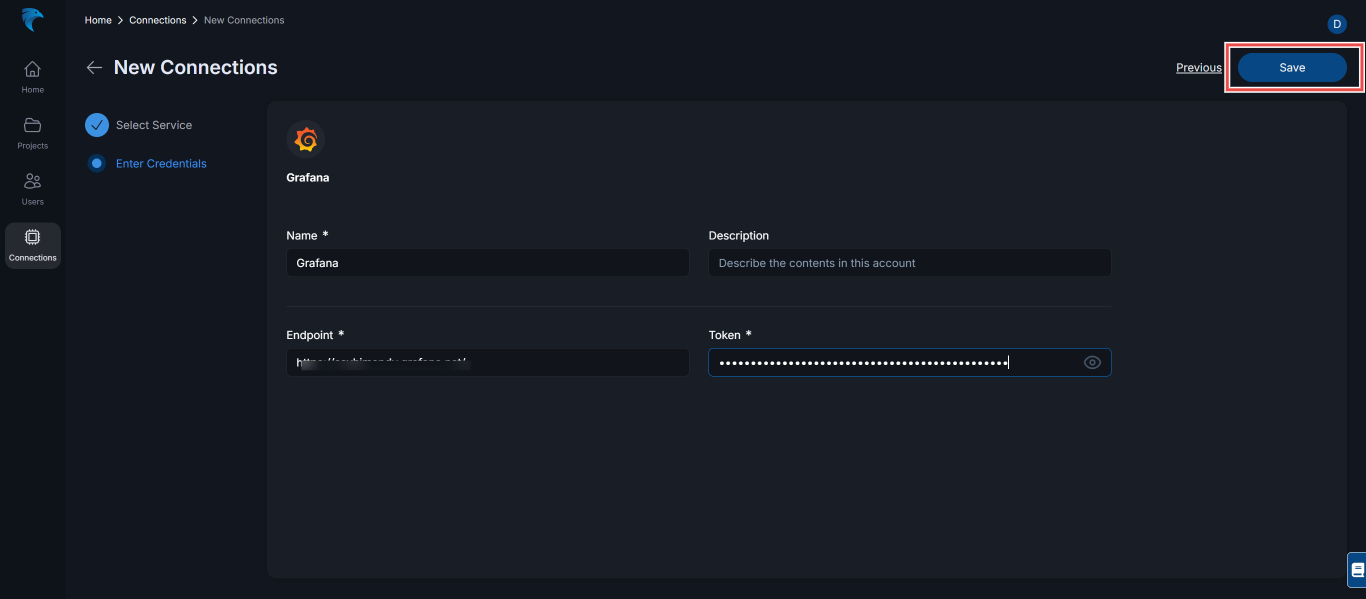
Fig.11 - Enter Grafana credentials
Click Save to complete the setup.
-
Verify connection: Once the connection is successfully established, navigate to the connections section in Hawkeye. You should see the Grafana connection card displayed on your dashboard.
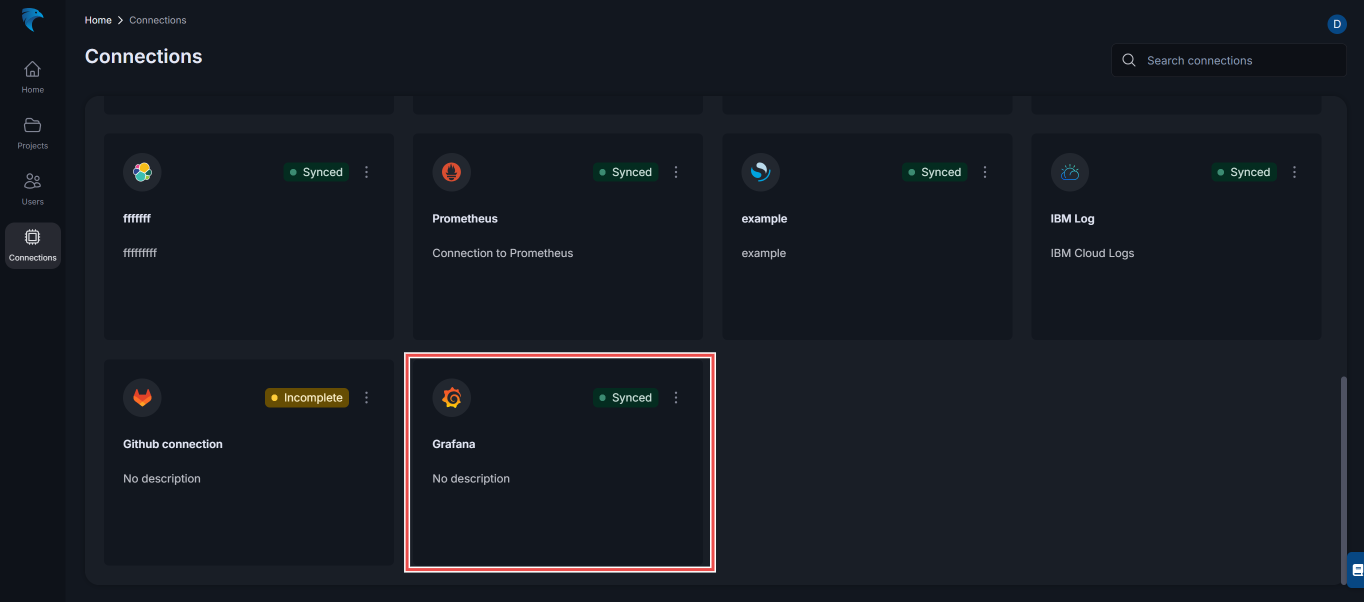
Fig.12 - Grafana connection created