Overview
Sessions in Hawkeye provide a live, interactive environment for monitoring, analyzing, and troubleshooting your connected services.
Each session focuses on an incident, project, or API integration, allowing for real-time querying, insights, and metrics visualization.
This section will guide you through navigating a session, the type of information returned, and how to query deeper for more insights.
What is a session?
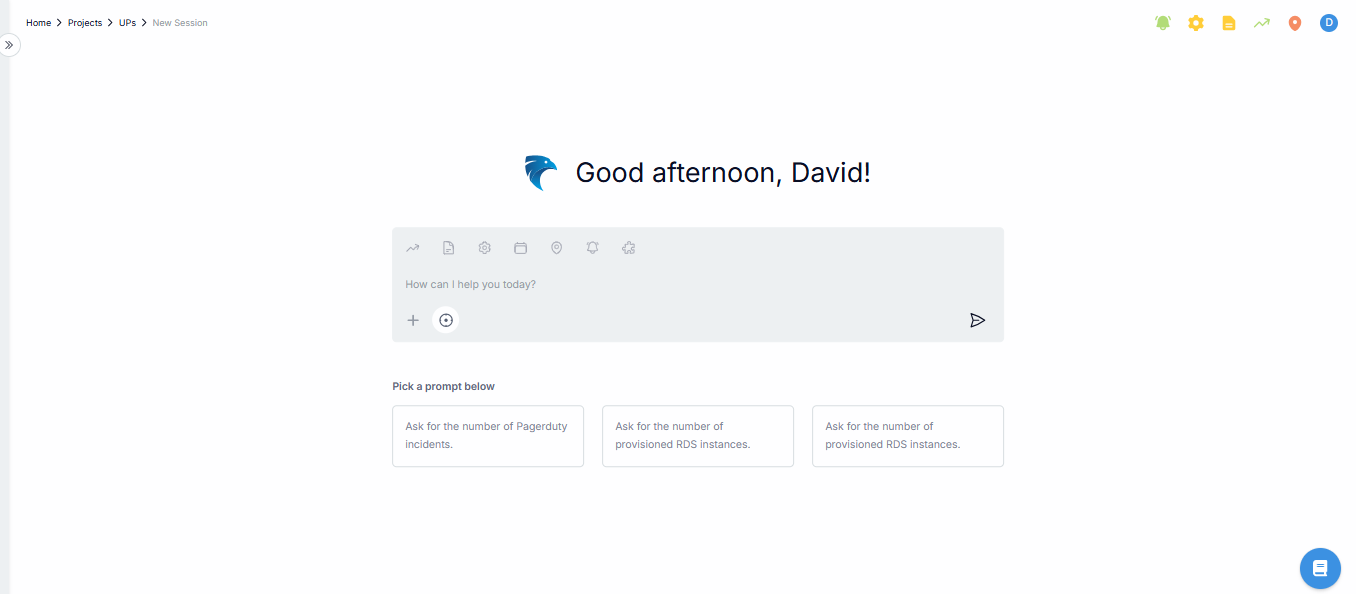
Fig.1 - Project Session
A session is a workspace within a project where you can interact with various data points, incidents, and logs.
It is designed to help you investigate issues, track performance, and monitor services by querying the system and receiving detailed analysis.
Within a session, you can view metrics, query for specific logs or events, investigate incidents, and get recommendations for further investigation based on the data at hand.
Key elements of a session page
A session page provides various tools and visualizations. In a sessions page interface, you’ll find the following sections:
Query input
This is where you input natural language questions regarding incidents, errors, or performance metrics.
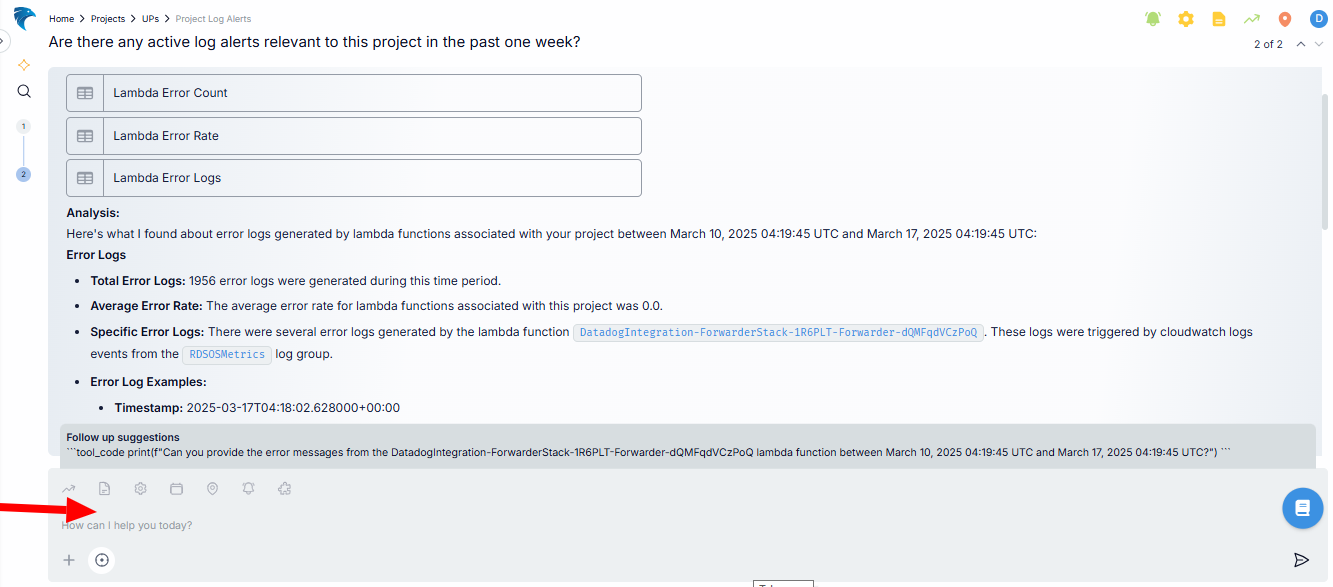
Fig.2 - Query input
Above the query input box, there are icon elements known as Telemetry States (you can also find them at the top-right corner of the session page), each element is explained (accordingly) below:
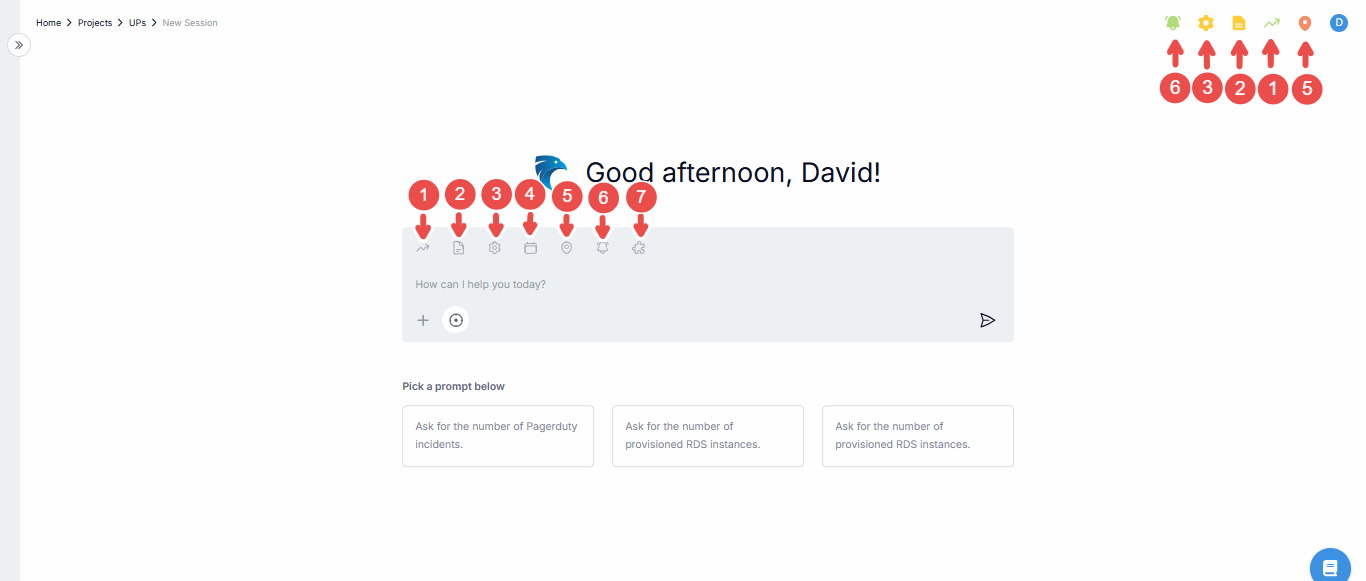
Fig.3 - Telemetry state
| No. | Telemetry State | Description |
|---|---|---|
| 1. | Metric | Focuses on querying or analyzing numerical data representing system performance, usage statistics, and other quantitative measurements (e.g., CPU utilization, request count). |
| 2. | Log | Queries and examines logs, which are time-stamped records of system or application events, errors, or other significant occurrences. |
| 3. | Config | Focuses on configuration data, typically used to review or monitor the settings and parameters applied to services, resources, or systems (e.g., API Gateway settings, database configurations). |
| 4. | Event | Looks into events, which are specific actions or occurrences within a system (e.g., a system restart, user login, resource creation). |
| 5. | Trace | Analyzes traces, typically associated with distributed tracing systems to track requests as they move through various services and applications. |
| 6. | Alarm | Focuses on alarms, which are alerts triggered by certain conditions or thresholds in the system (e.g., high latency, errors exceeding a threshold). |
| 7. | Generic | Captures queries or insights that do not fit into the specific categories mentioned above, possibly more abstract or general types of data sources. |
Chain of thought
This section displays the investigative process being followed by the system, guiding you step-by-step through possible lines of inquiry.
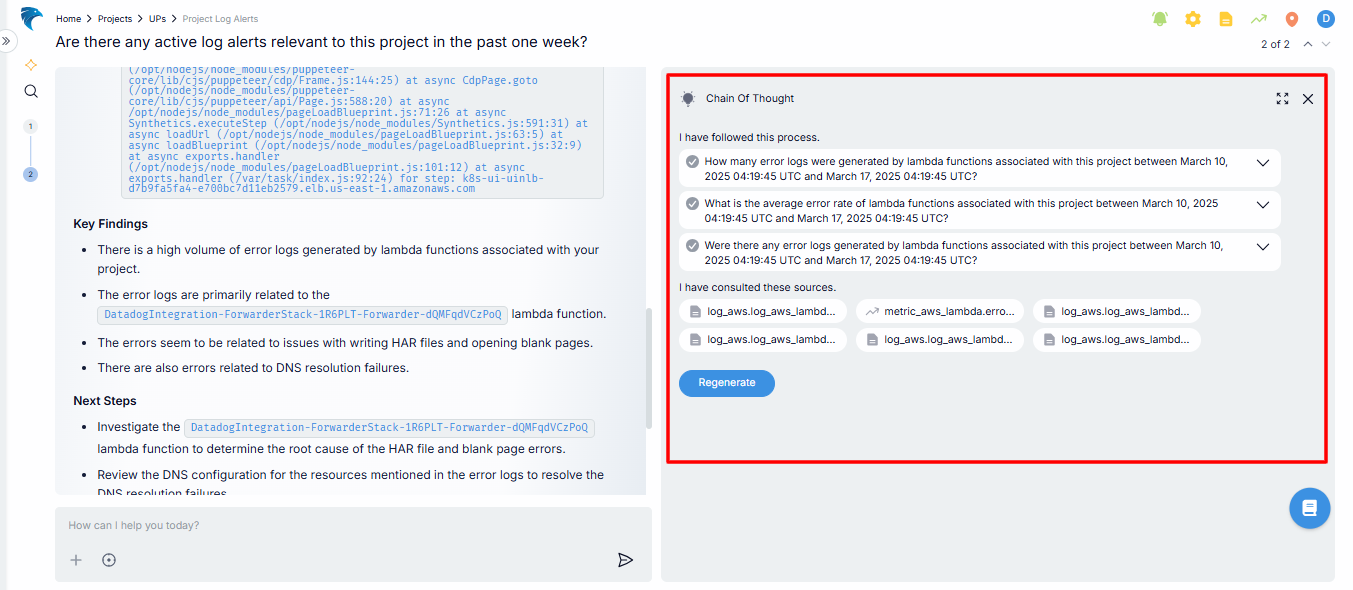
Fig.4 - Chain of thought
Each line of thought you’re exploring is marked with an icon:
- A check icon means the thought process was successfully completed
- A caution icon signals that it wasn’t.
You can click on any of these thought processes to go into the details.
At the top-right corner, you can use the expand icon to expand the section, or use the close icon to exit.
Additionally, as you work through your investigation, you’ll see a list of sources consulted. At the end of the page, you’ll find a Regenerate button, allowing you to pull new insights or continue building on your existing thought process.
Follow-up suggestions
Based on the current query, our system suggests follow-up questions that help you investigate the issue.
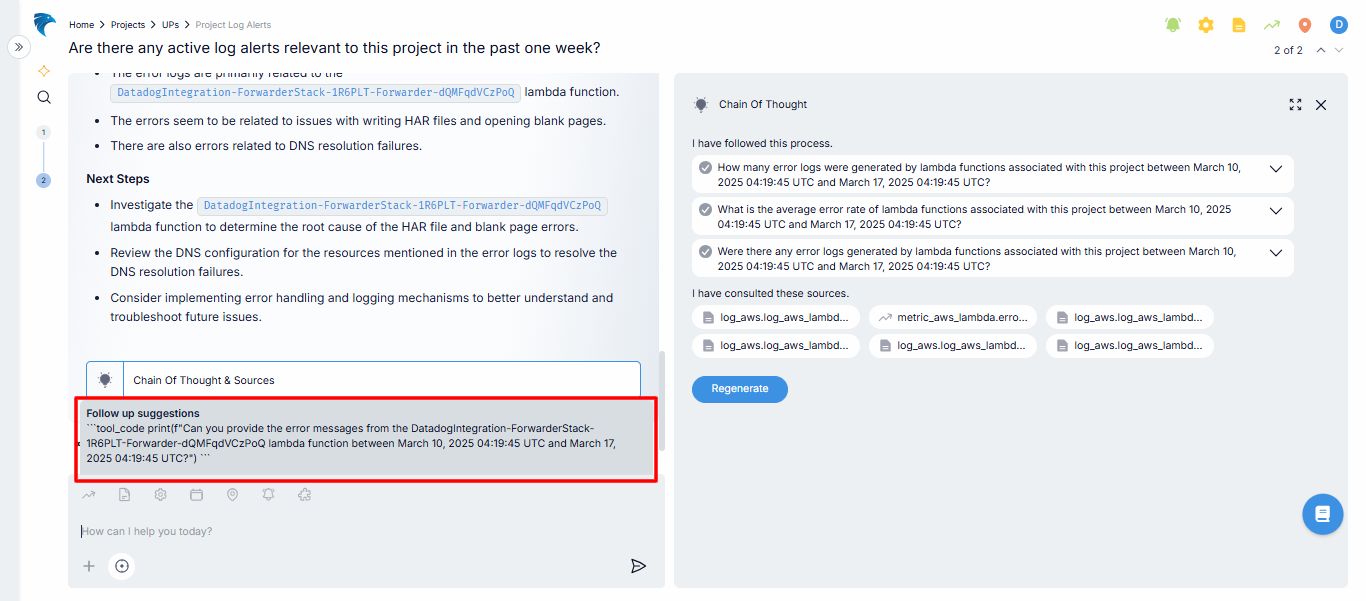
Fig.5 - Follow-up suggestion
At the bottom-left of the analyis section, you’ll notice an Export icon. This lets you export your entire query history in multiple formats, making it easy to review or share. There’s also a handy Copy icon, so you can quickly copy your query history with just a click.
Next to each query, you can Regenerate a query using the Regenerate icon, or provide feedback by using the Thumbs Up or Thumbs Down icons to rate how helpful it was. And to go even deeper, there’s an X-ray of Thoughts option, allowing you to visually explore the reasoning behind each query and response.
Fig.6 - Export or share project analysis Demo
Interaction in a session
When navigating a session, the interaction revolves around querying the system for insights. A regular interaction will follow the procedure below:
-
Initial query: You start by asking a question relevant to your type of connection. For example, if you want to get a log alert, you can ask, “Are there any active log alerts relevant to this project in the past one week?” (or select a question from the prompts provided).
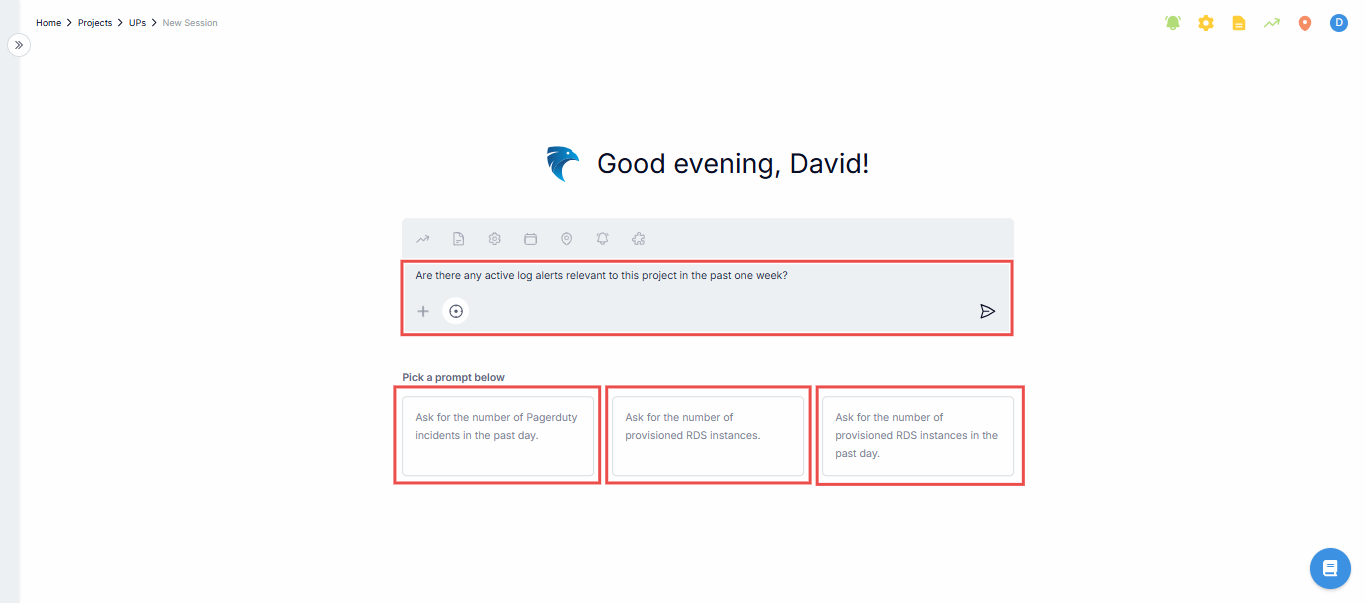
Fig.7 - Initial query
-
Analysis: After querying Hawkeye, it will analyze the relevant logs and metrics and present a summary with detailed information on when and why the errors occurred.
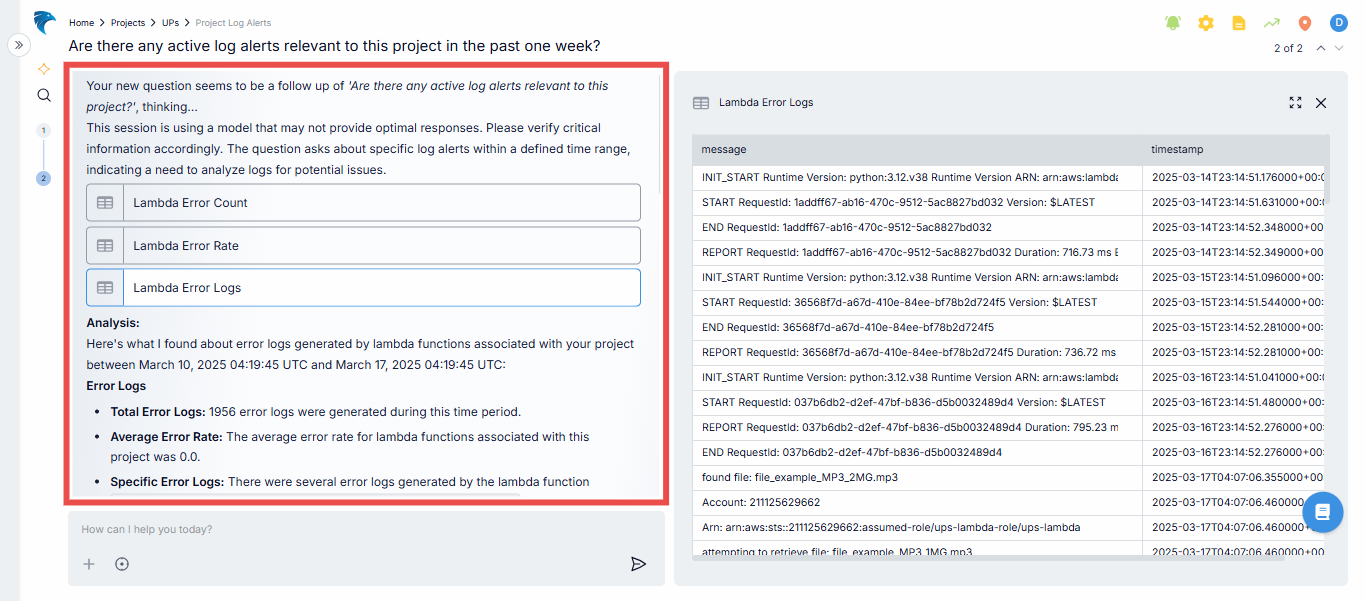
Fig.8 - Session analysis
-
Follow-up questions: Based on the initial results, Hawkeye might suggest related queries like:
- “Can you provide the error messages from the datadog integration?”
- “What was the CPU utilization of Lambda functions at the time?”

Fig.9 - Follow-up suggesstions
-
Continuous investigation: You can continue investigating specific aspects of the incident, adjusting your questions to narrow down the root cause.