Overview
A connection links Hawkeye to your existing infrastructure, allowing it to gather telemetry data, monitor performance, and analyze events from different services in real-time.
The connections section of the dashboard is where you can view your active integrations and add new ones to extend Hawkeye’s reach across your IT operations.
This guide will show you how to manage and create new connections.
Creating a new connection
You’ll find the “New Connection” card on the connections tab. Click on it and follow the steps below to add a new connection:
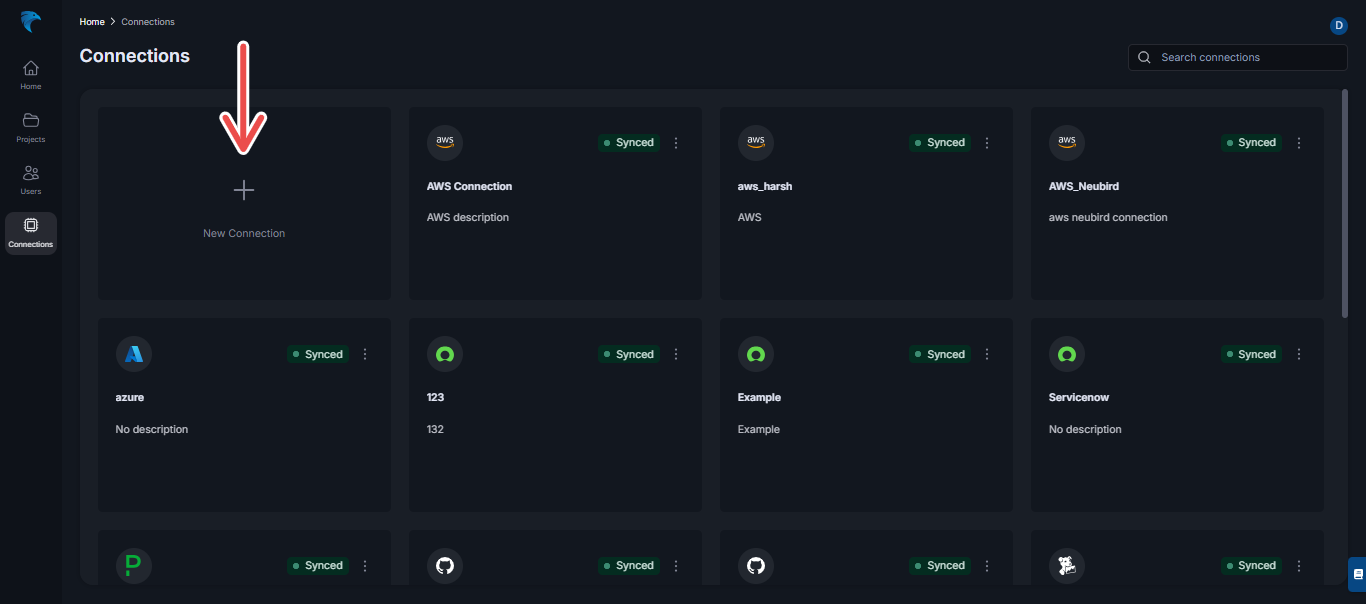
Fig.1 - New connection
-
Select service: After clicking on the “New Connection” card, you’ll be prompted to choose a connection type, such as AWS, Azure, or other supported platforms.
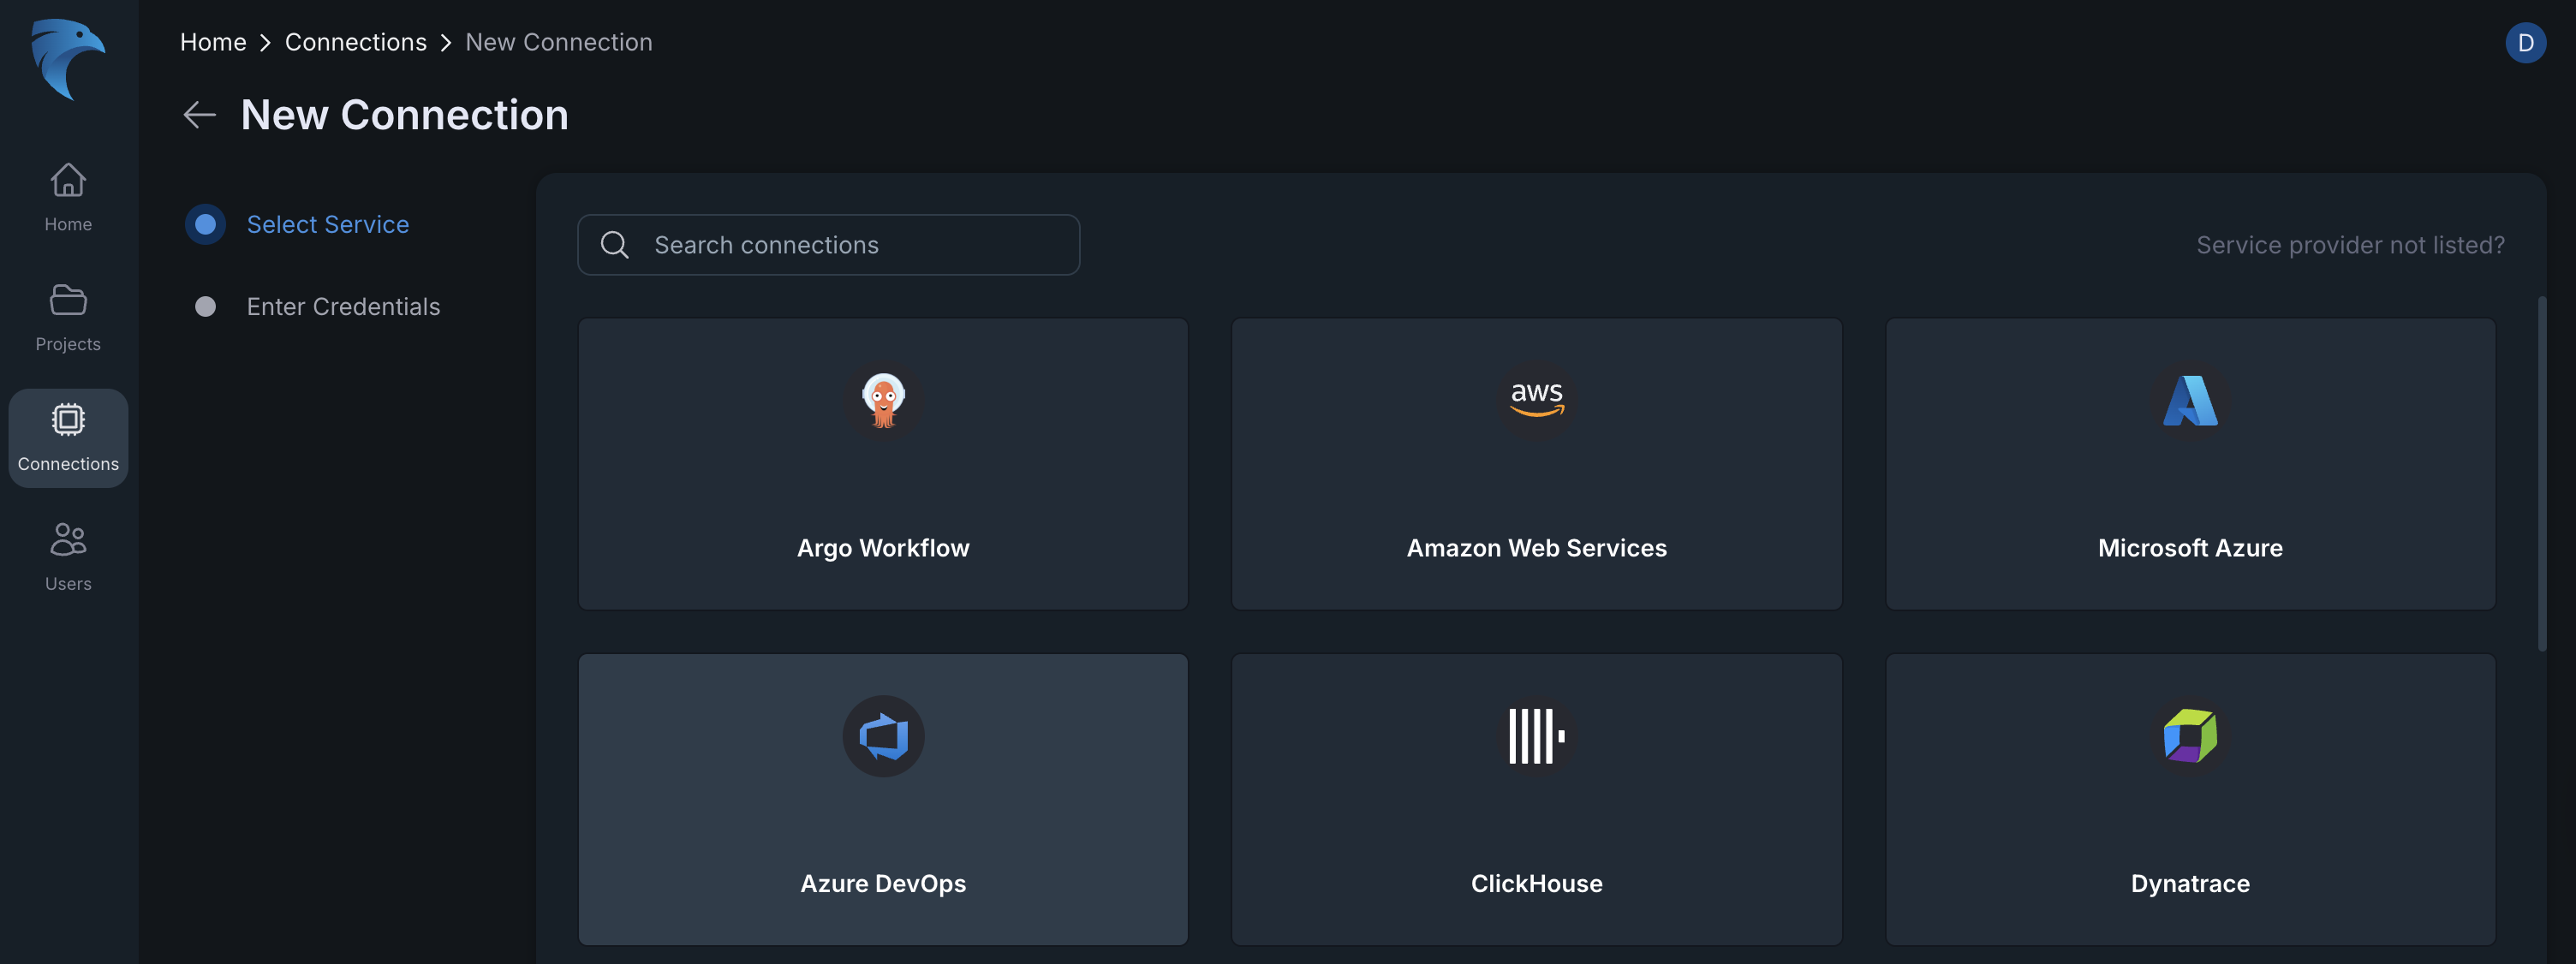
Fig.2 - Select service
After selecting the connection type, click the Next button at the top right corner.
-
Configure the connection: After selecting the connection type, you’ll be provided a form to input the necessary credentials. You can use any of the form options from the tab.
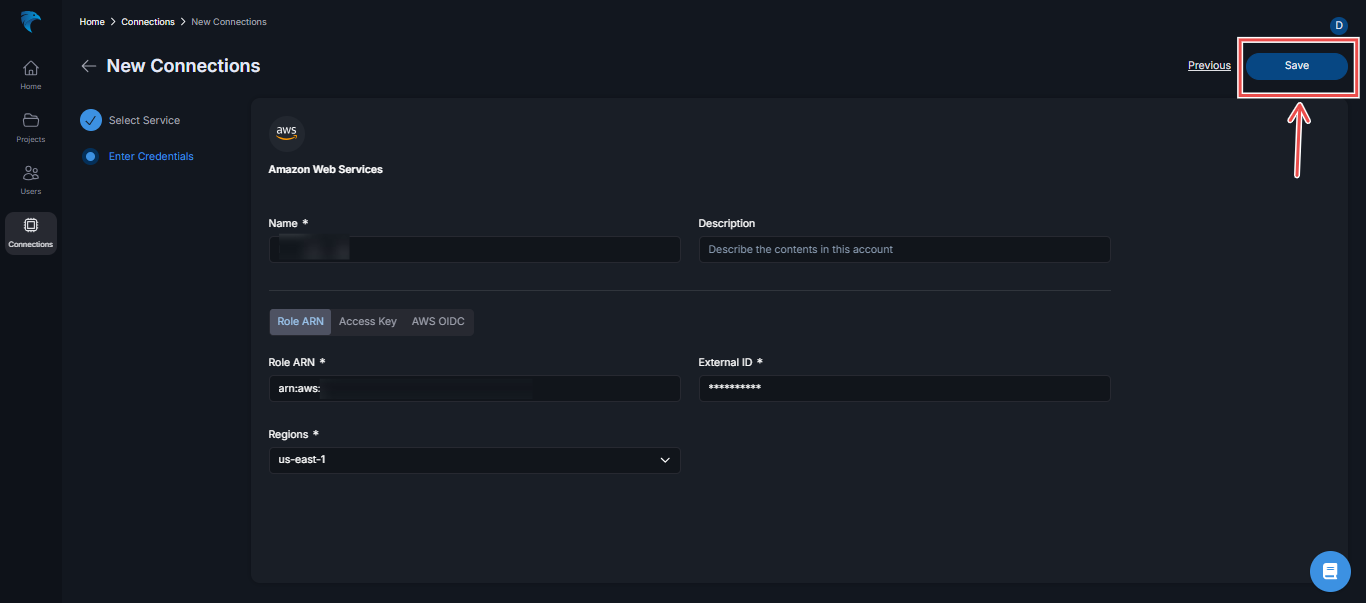
Fig.3 - Configure connection details
After adding these credentials, click the Save button at the top right corner.
Supported Connections and Telemetry Types
This table provides an overview of the connections we support and the types of telemetry data available for each. Telemetry refers to the monitoring data collected from each system, including Logs, Alerts, Metrics, Configurations, and Traces. This helps teams understand which monitoring capabilities are available for each integration, enabling better observability, incident management, and system analysis.
| Connection | Telemetry Supported |
|---|---|
| AWS (Amazon Web Services) | Logs, Alerts, Metrics, Config |
| Microsoft Azure | Alerts, Metrics, Config, Logs |
| ServiceNow | Alerts |
| Elastic | Alerts, Logs |
| Prometheus | Metrics |
| OpenSearch | Logs |
| IBM Cloud Logs | Logs |
| DSL | Logs |
| Snowflake Data Cloud | Logs |
| Grafana | Logs, Metrics |
| KloudFuse | Logs, Metrics |
| Google Cloud | Logs, Metrics, Config |
| Slack | — |
| FireHydrant | Alerts |
| Incident.io | Alerts |
| InfluxDB | Metrics |
| Dynatrace | Alerts, Metrics, Traces, Logs |
| PagerDuty | Alerts |
| GitHub | Config |
| Datadog | Alerts, Metrics, Traces, Logs |
| Azure DevOps | Config |
| Splunk | Logs, Alerts |
| SignalFX | Metrics, Alerts |
IP Allowlisting for Telemetry Access
For customers with private telemetry sources, you must allowlist the following IP address so that Neubird Telemetry can communicate properly:
Navigating an existing connection
Once your connections are set up, you can easily manage them from the connections section. The following steps will show you how to navigate your existing connections:
-
Accessing connection options: Locate the three-dotted menu icon on your connection card at the top-right corner. Clicking on this icon will open a dropdown menu providing options which include the following:
-
Edit Allows you to view the name, description and other details of the connection.
-
Refresh: Allows you to refresh the state of a connection.
-
Delete: You can remove an existing connection from your connection list.
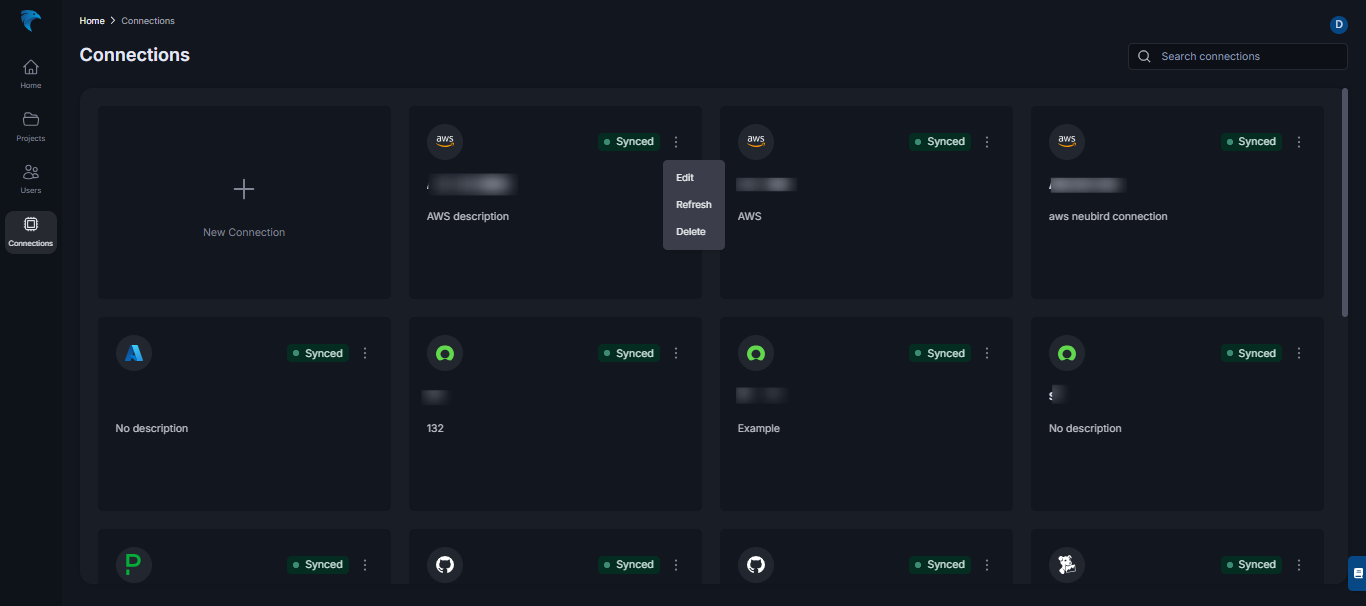
Fig.4 - Accessing connection options
-
-
Edit Connection: On the Connections page, select Edit from the connection’s dropdown menu to open the edit view.
The edit view is divided into two separate screens:
-
Details – where you can view and update the connection name, description, and other connection-related information.
-
Telemetry – where you can configure and modify telemetry settings associated with the connection.
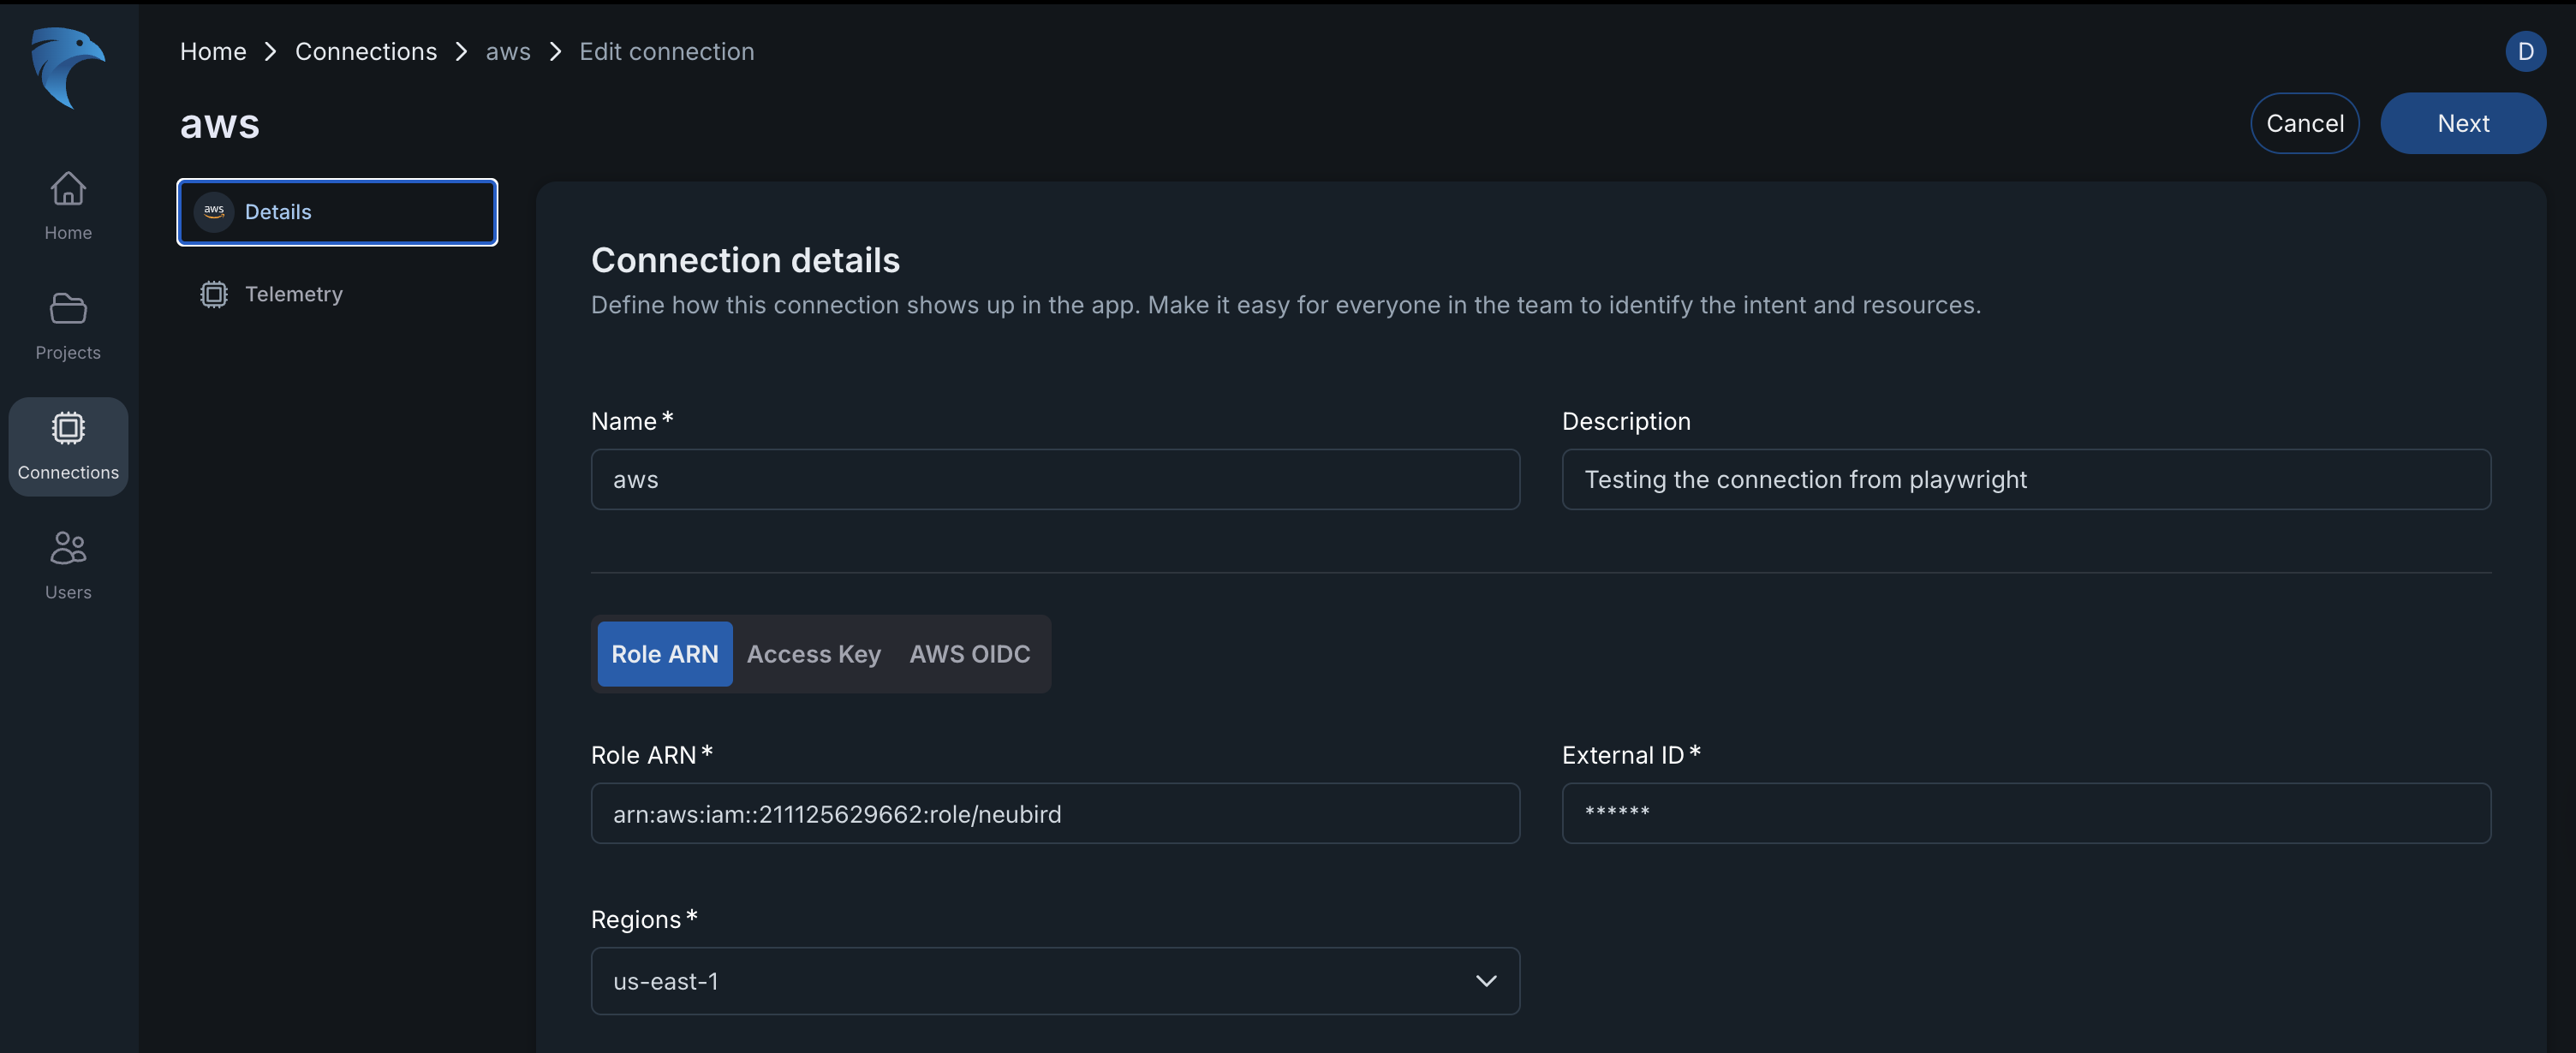
Fig.5 - Edit Details connection options
Editing the connection info required to connect to the customer’s environment. This will allow customers to smoothly update the api keys, tokens, roles, etc. that they’ve given us in their connection, and we will rediscover the environment based on the new credentials and update our data. The connection will remain in projects that it’s already in. An edit connection will fail if its edited to a key that can’t reach the customer environment. This feature should be enabled on all deployments, to gather screenshots from.
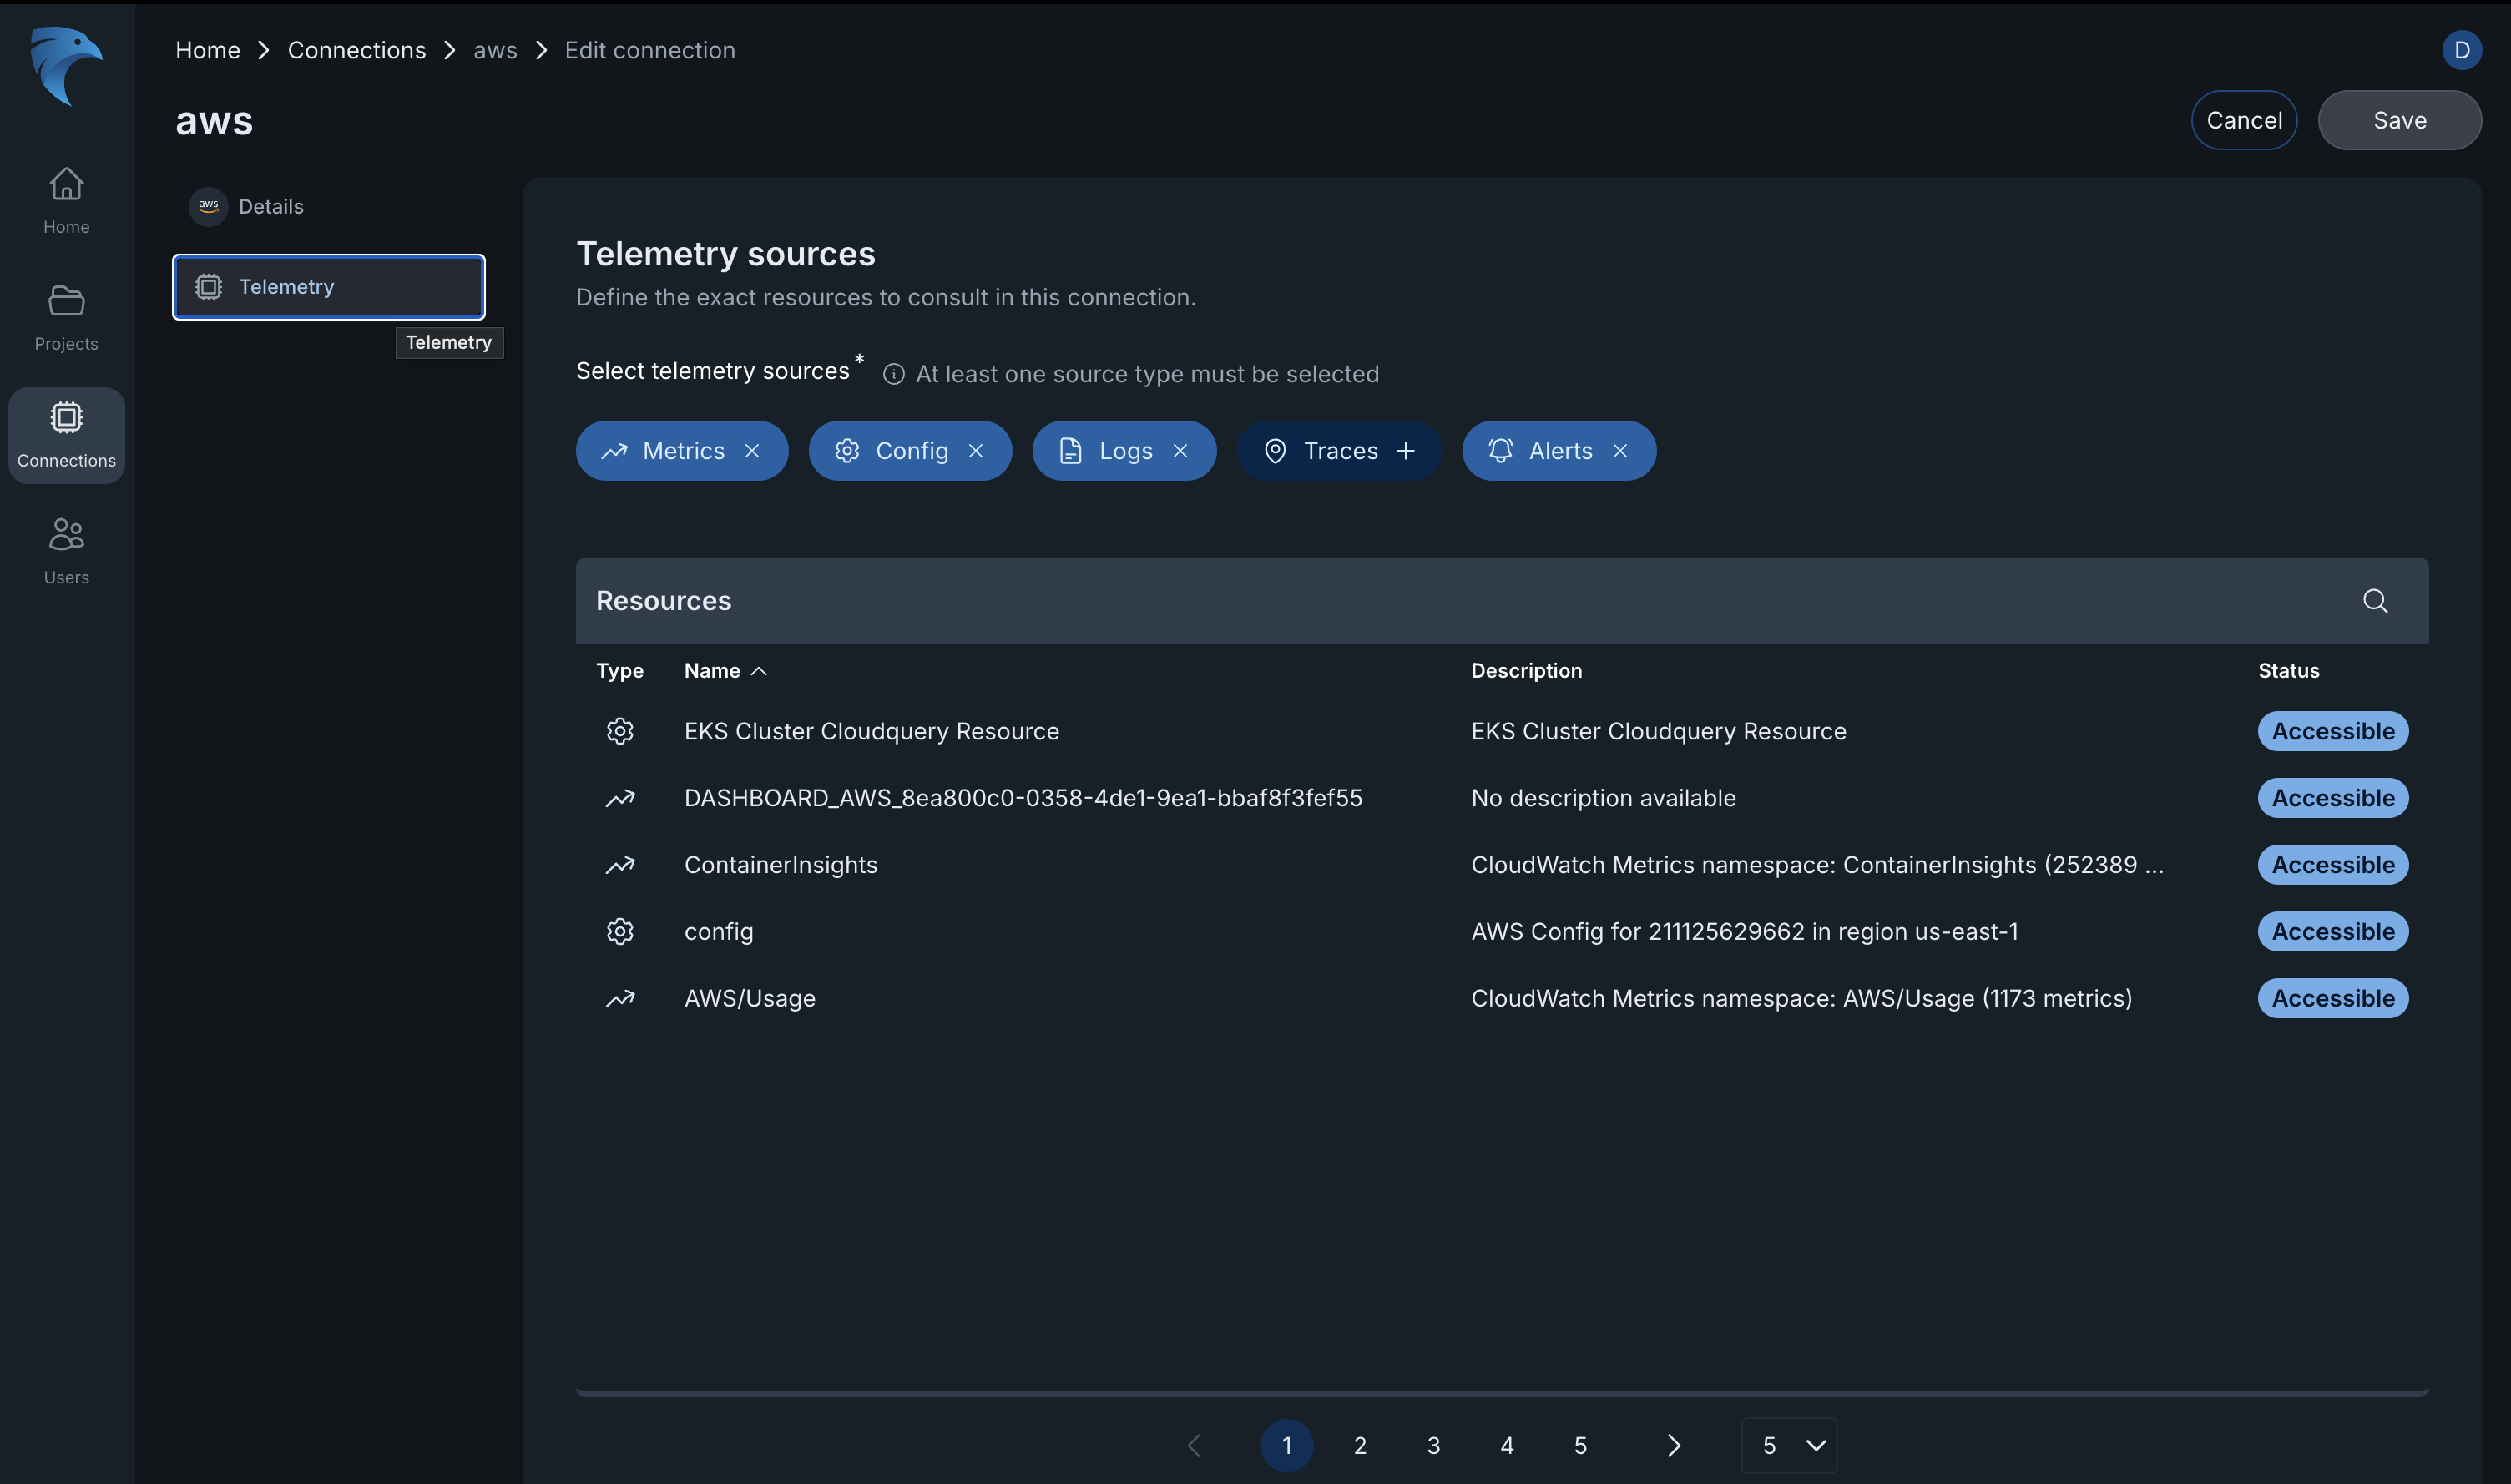
Fig.6 - Edit Telemetry connection options
Editing the telemetry section in the flow allows a user to change the current blocked/enabled state for different telemetry types within a connection. For example, you can block or unblock metrics from a datadog connection, such that you only have logs, traces, and alerts. This can be turned on/off as required, and will apply to all projects connected to that project. There will be a list of resources that will be included based on the final set of telemetry resources that are allowed, to give you an idea of what exists within a connection (i.e. which log groups, or metric namespaces in AWS)
-
After making your changes on either screen, click Save in the top-right corner to apply and store your updates.