Prometheus
Connecting Hawkeye to your Prometheus instance allows it to collect telemetry data, such as metrics, from your infrastructure.
This connection allows you to monitor key performance indicators and resource utilization in real-time through Hawkeye.
Step 1: Set Up Prometheus Integration
Fig.1 - A walkthrough of how to setup Prometheus integration
To connect Prometheus to Hawkeye, you need to ensure that your Prometheus instance is accessible and configured correctly.
-
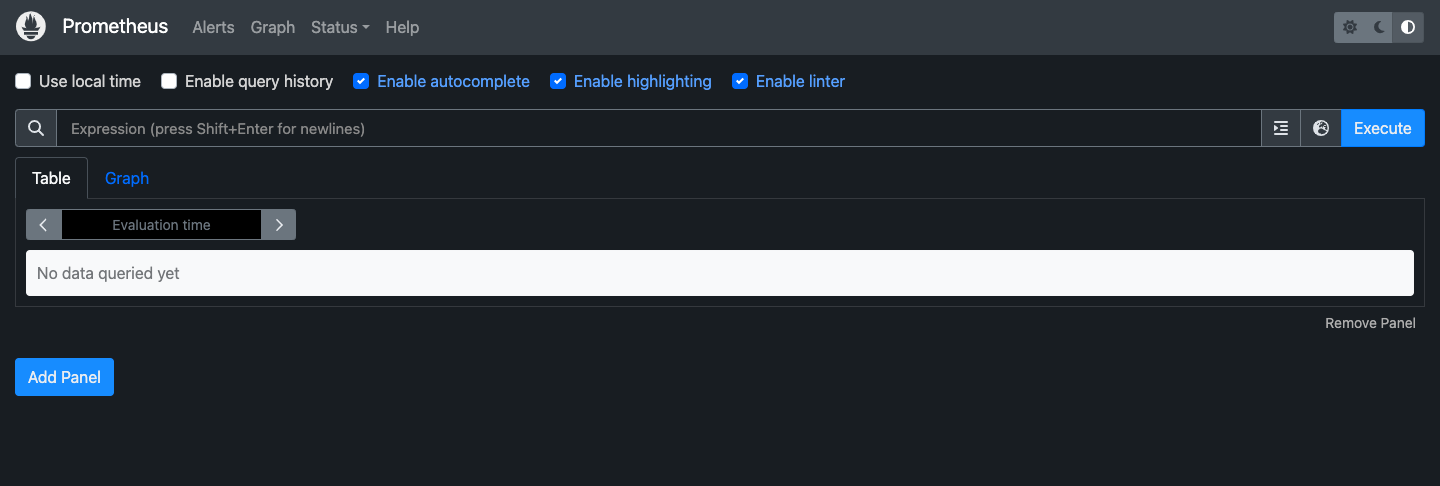
Set up Prometheus: Make sure you have a running Prometheus instance. If you don’t have one, you can install Prometheus by following the official guide.

Fig.2 - Prometheus setup
-
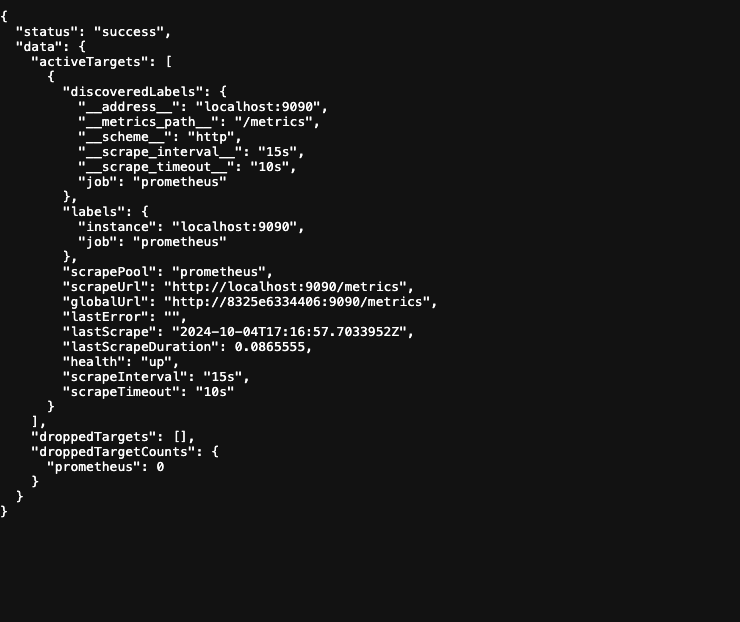
Check for API accessibility: You can test if the Prometheus API is working by accessing
http://<prometheus-server>:9090/api/v1/targetsin your browser or using curl:Terminal window curl http://<prometheus-server>:9090/api/v1/targets
Fig.3 - API accessibility
This should return a list of Prometheus targets that are being monitored.
-
Gather necessary details: Retrieve the URL of The Prometheus server. This is looks like
http://<prometheus-server>:9090.
Step 2: Add Prometheus Connection to Hawkeye
Now that Prometheus is set up and accessible, follow these steps to connect it to the Hawkeye dashboard.
-
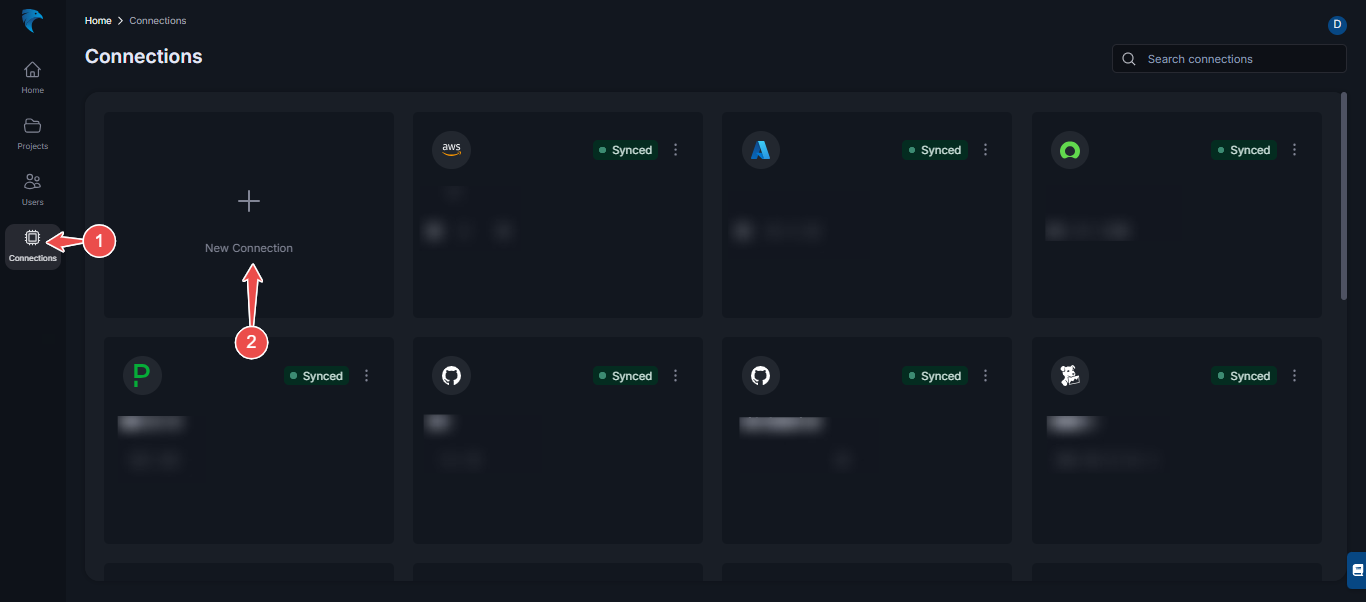
Navigate to the Connections Tab: On the Hawkeye dashboard, go to the Connections section and click on New Connection.

Fig.4 - Create new Prometheus connection dashboard
-
Select Prometheus: From the list of available integrations, choose Prometheus.
Then, click Next at the top right corner.
-
Enter Credentials:
- Name: Give your connection a descriptive name, such as “Prometheus Integration”.
- Description: Optionally, add a description for the integration.
- URL: Enter the Prometheus server URL (e.g.,
http://<prometheus-server>:9090).
-
Save the connection: Once you’ve filled in the required fields, click Save to complete the setup.
-
Verify connection: After successfully establishing the connection, navigate back to the connections section in Hawkeye. You should see the Prometheus connection card displayed on your dashboard, indicating that the connection is active.