Project Dashboard
Clicking on your Project card on Hawkeye takes you to your project dashboard. The Dashboard is an interface that gives an overview of incidents alerts and investigations relavant to your Project.
The Dashboard Interface
The Dashboard provides a unified view of your system’s monitoring status, including alerts, incidents, and ongoing investigations. It helps engineers quickly identify and resolve operational issues.
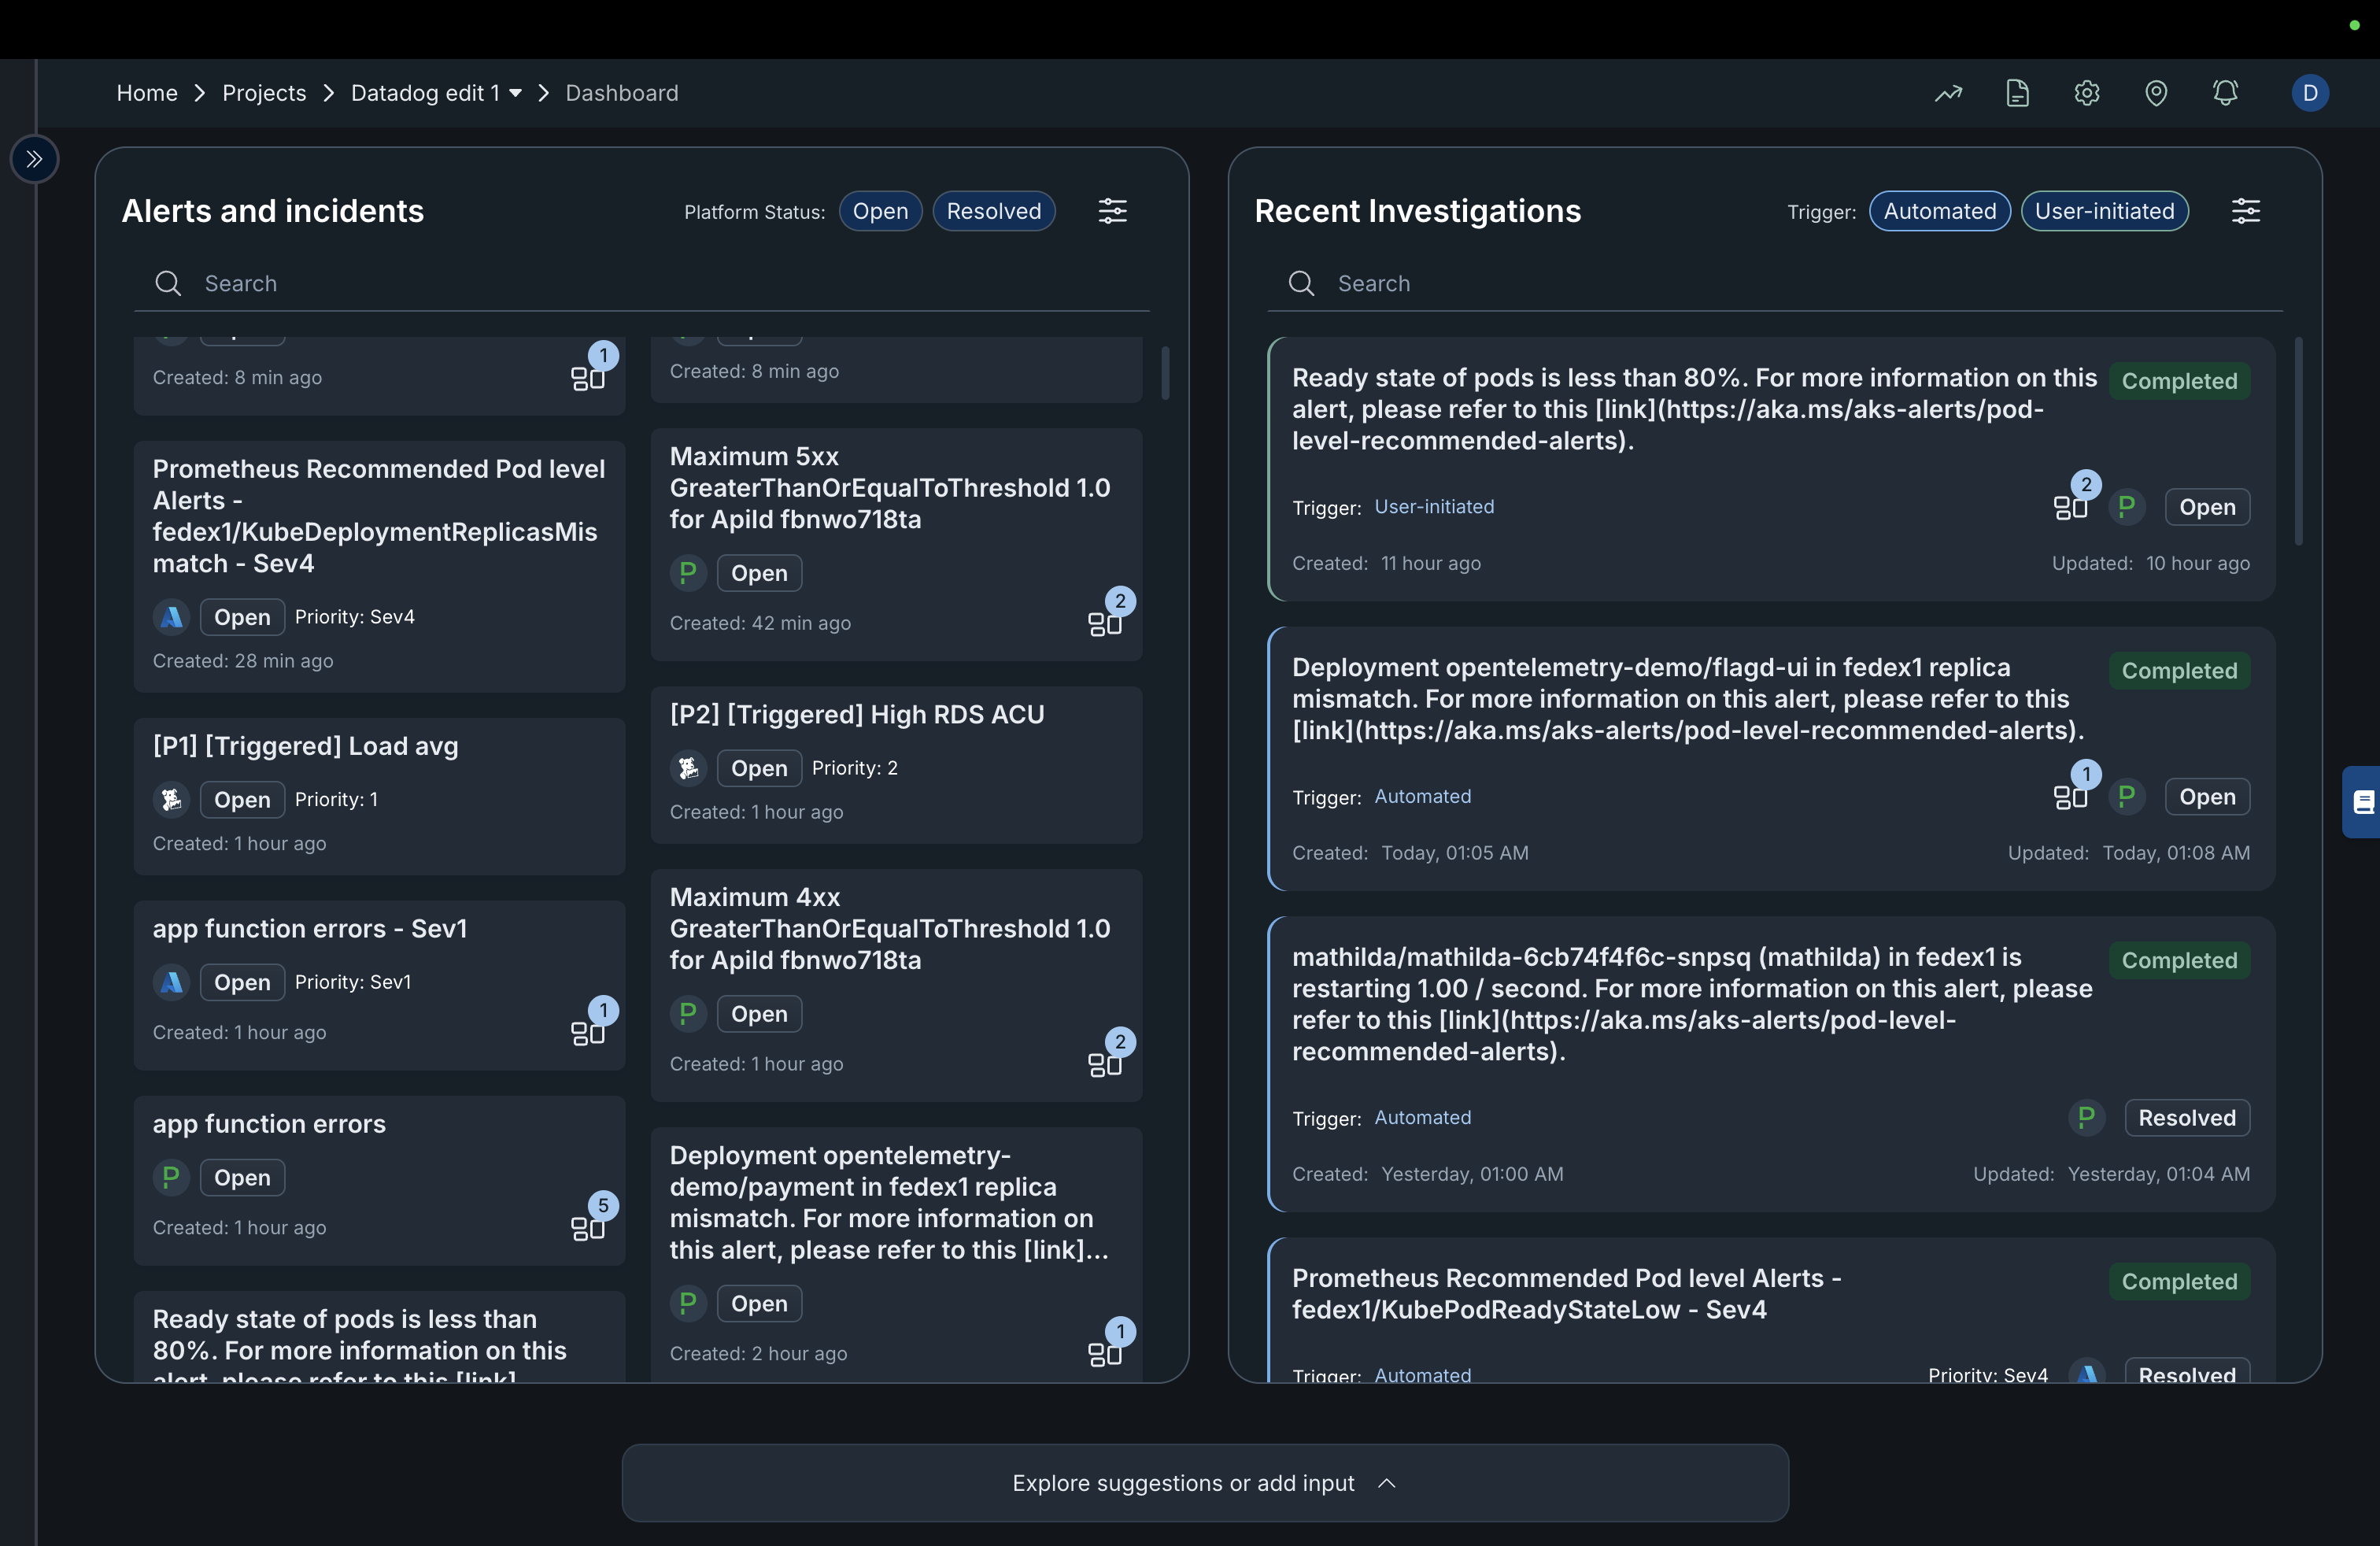
Fig.1 - Project Dashboard dashboard page
-
Alerts and Incidents Panel (Left Section)
This section lists all active and resolved alerts related to your project connection like Pagerduty, AWS cloud watch alert, Splunk alerts etc.
Incidents: Are recorded events where something unexpected or undesired has occurred within your project or connected systems.
Alerts: Are automated notifications triggered when predefined conditions or thresholds are met. They act as early warnings to draw your attention to potential problems before they escalate into full incidents.
Key Elements
-
Platform Status Toggle:
Located at the top of the panel, this lets you filter alerts by status:- Open: Only alerts that are yet to be investigated or completed.
- Resolved: Only alets that have been investigated and completed.
-
Search Bar:
Use the search box to locate specific alerts by keywords or identifiers. -
Alert Cards:
Each card represents an alert or incident and provides quick access to critical information.Card Details:
- Title: Short description of the alert (e.g., “Prometheus Recommended Pod level Alerts – fedex1/KubeDeploymentReplicasMismatch – Sev4”).
- Status Badge: Displays the current state (Open or Resolved).
- Priority Level: Indicates severity (e.g., Sev1, Sev2, Sev4).
- Created Timestamp: Time since the alert was generated.
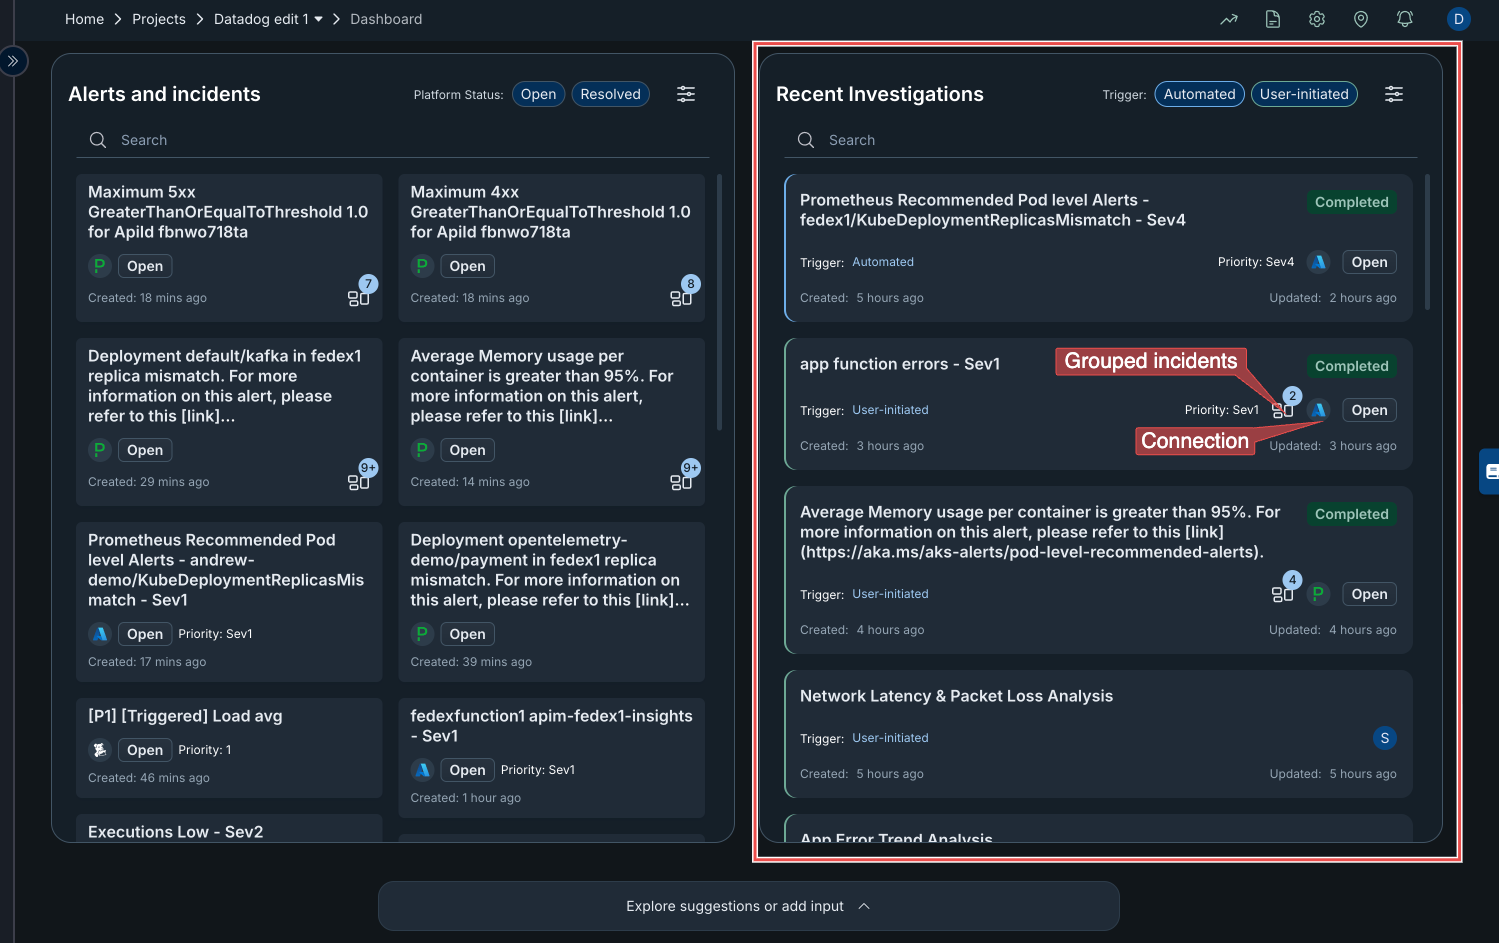
- Grouping Icon:
The small stacked-square icon represents grouped incidents, multiple related alerts aggregated under a single issue for easier management and correlation.
A numeric badge beside the icon indicates how many alerts are part of that group.
The Demo below will help you explore Incidents and alerts on the project dashboard
You can also follow the guide below to explore Incidents and Alerts.
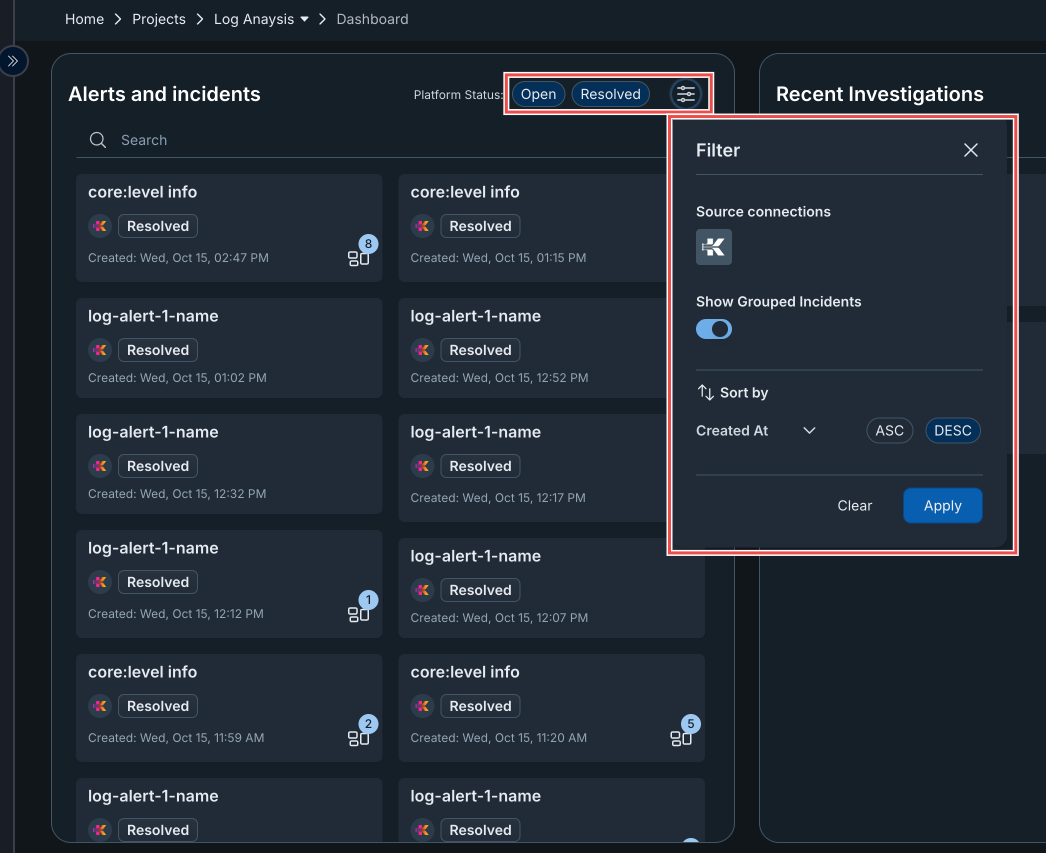
Filter Panel The Filter panel helps you refine and organize how alerts and incidents are displayed on the dashboard. You can open this panel by clicking the gear icon next to the Open and Resolved buttons at the top-right corner of the Alerts and Incidents section.
Filter Options
-
Open Incidents and alerts: Only alerts that are yet to be investigated or completed.
-
Resolved Incidents alerts: Only alets that have been investigated and completed.
-
Source connections Allows you to select which data source or integration (eg, AWS, Azure, etc.) to filter incidents from. Only alerts originating from the chosen source will be displayed.
-
Show Grouped Incidents When toggled on, this option displays incidents that have been grouped together based on similar characteristics (e.g., same root cause or repeated patterns). Turning it off will show individual alerts separately.
-
Sort by Lets you sort incidents by specific criteria.
- Created At – Sorts alerts based on their creation time.
- You can choose ASC (Ascending) to show the oldest alerts first or DESC (Descending) to show the newest ones first.
You can save your changes by clicking the Apply button or reset to default settings clicking the Clear button.
You can click on an Open or a Resolved incidents card to run an investigation.
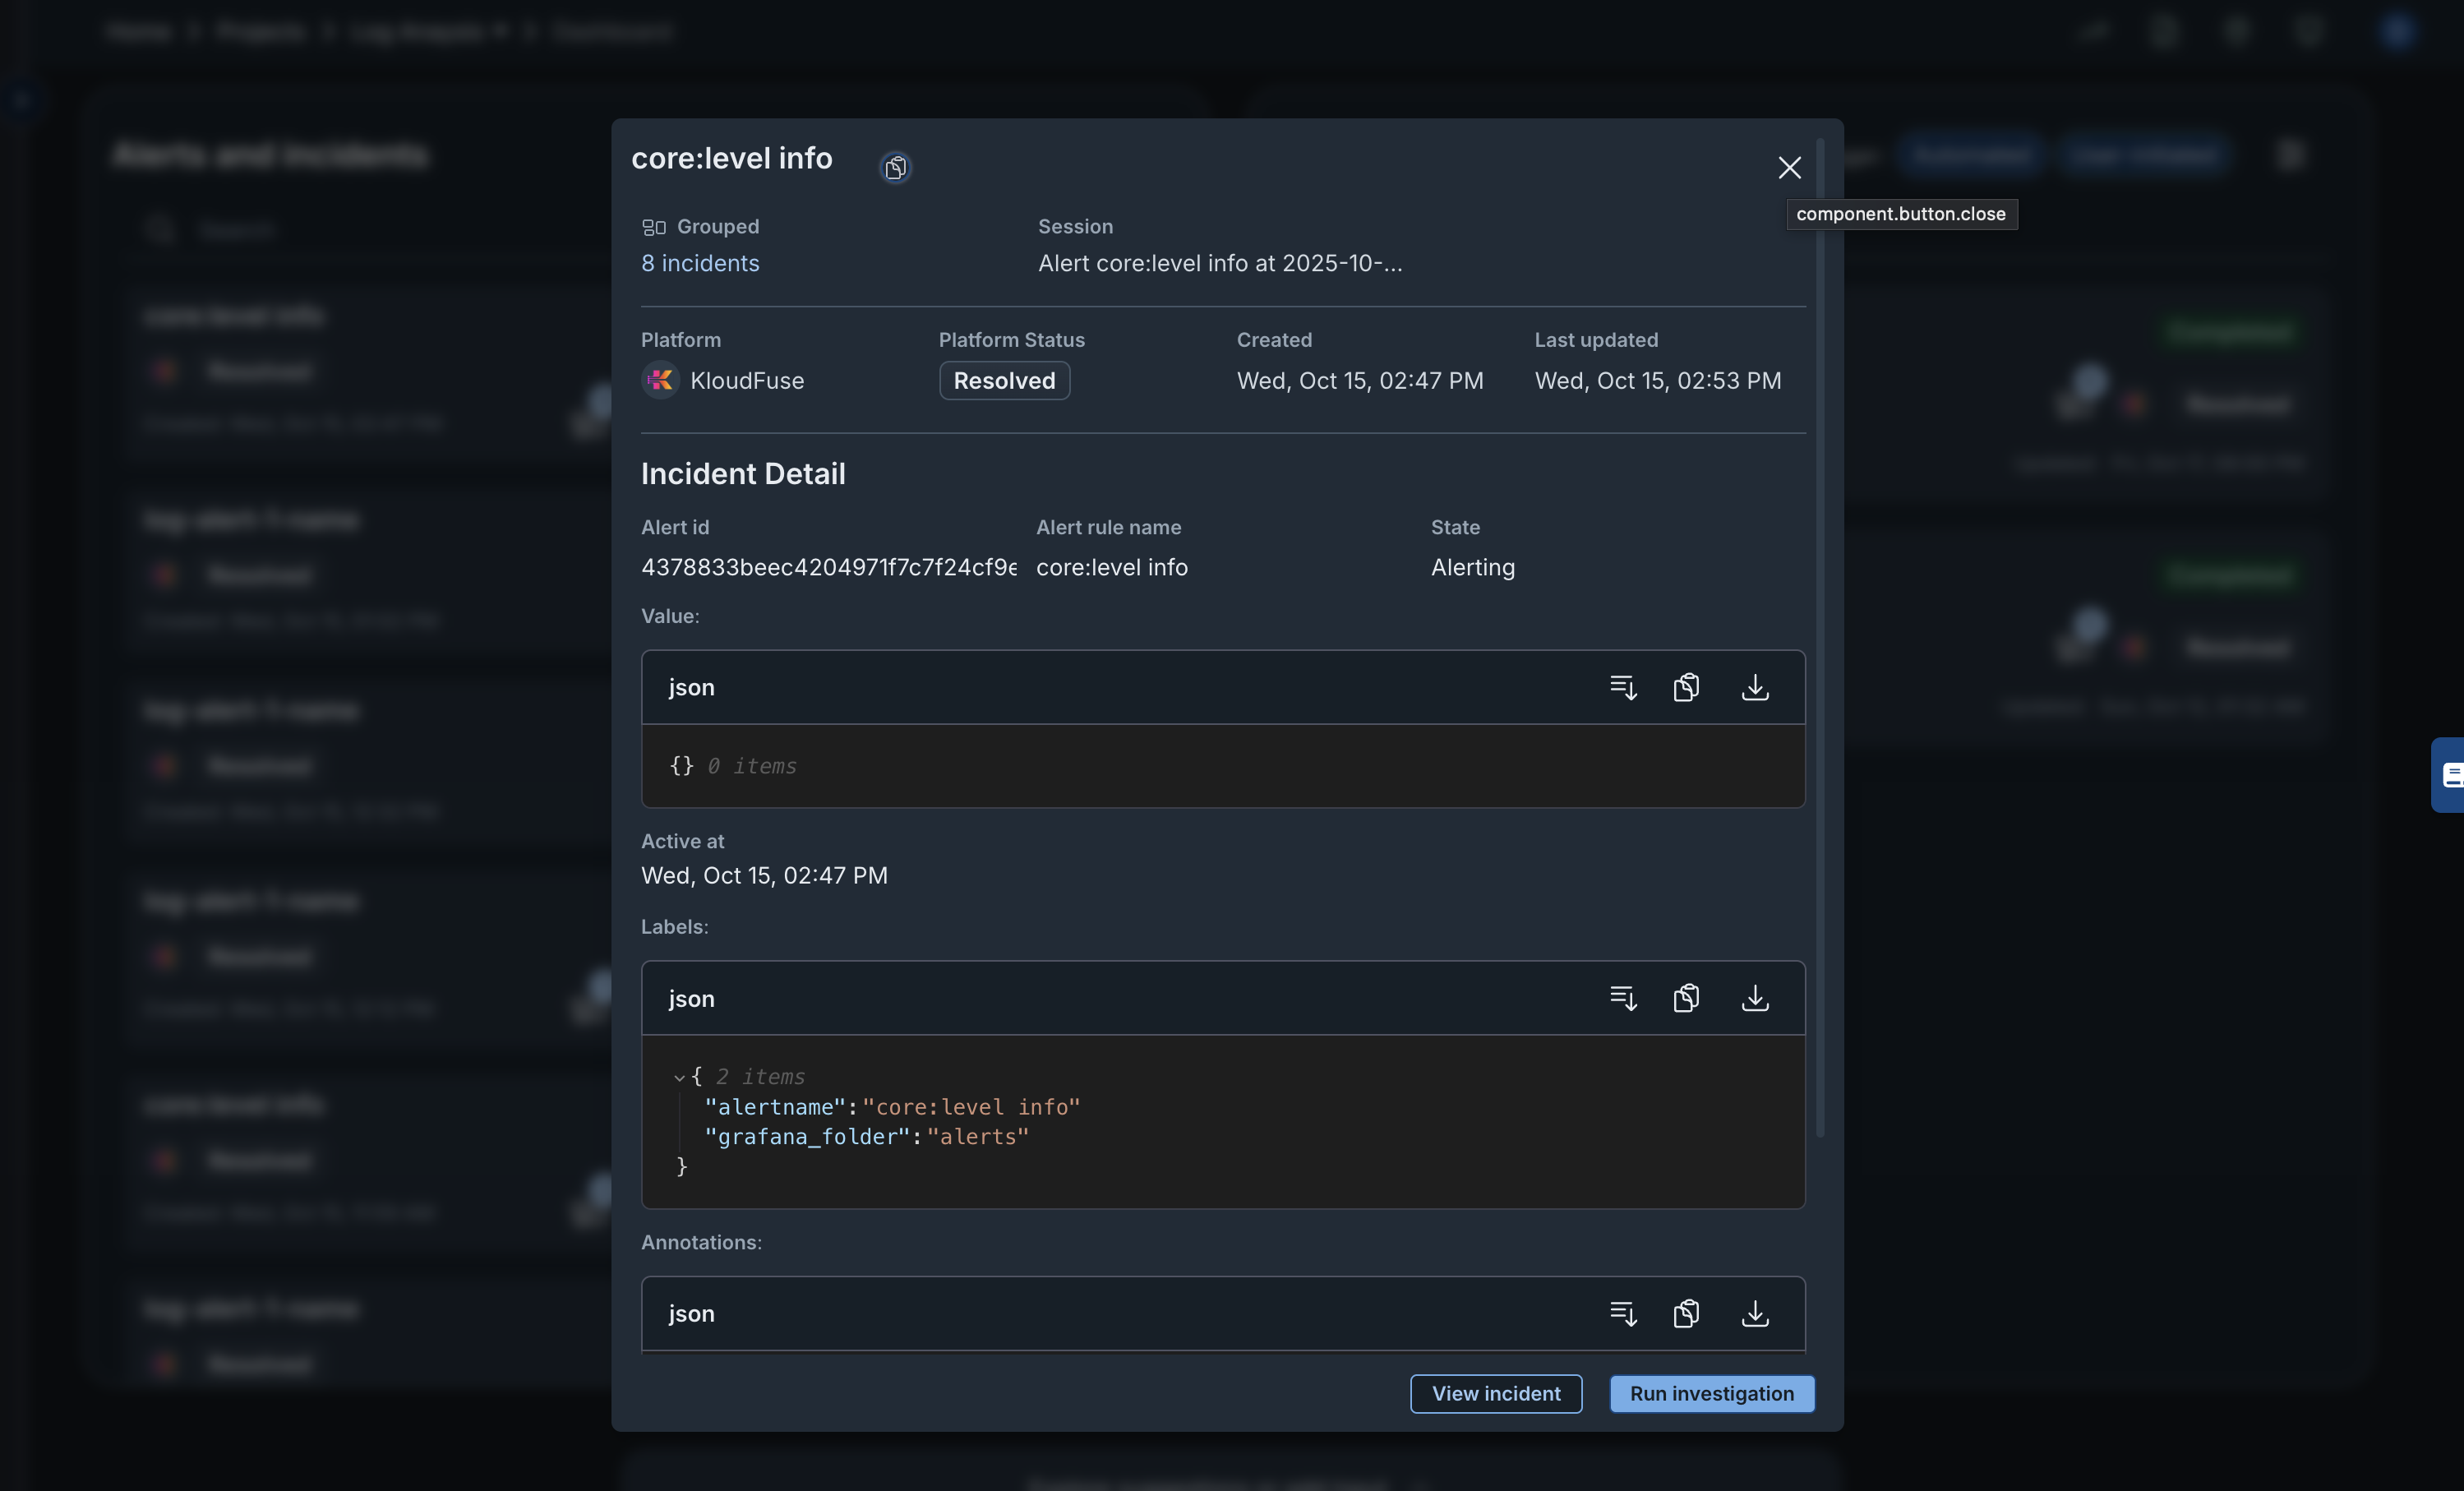
Running an investigation allows Hawkeye to give you an in-depth analysis of the incident by clicking on the Run Investigation button.
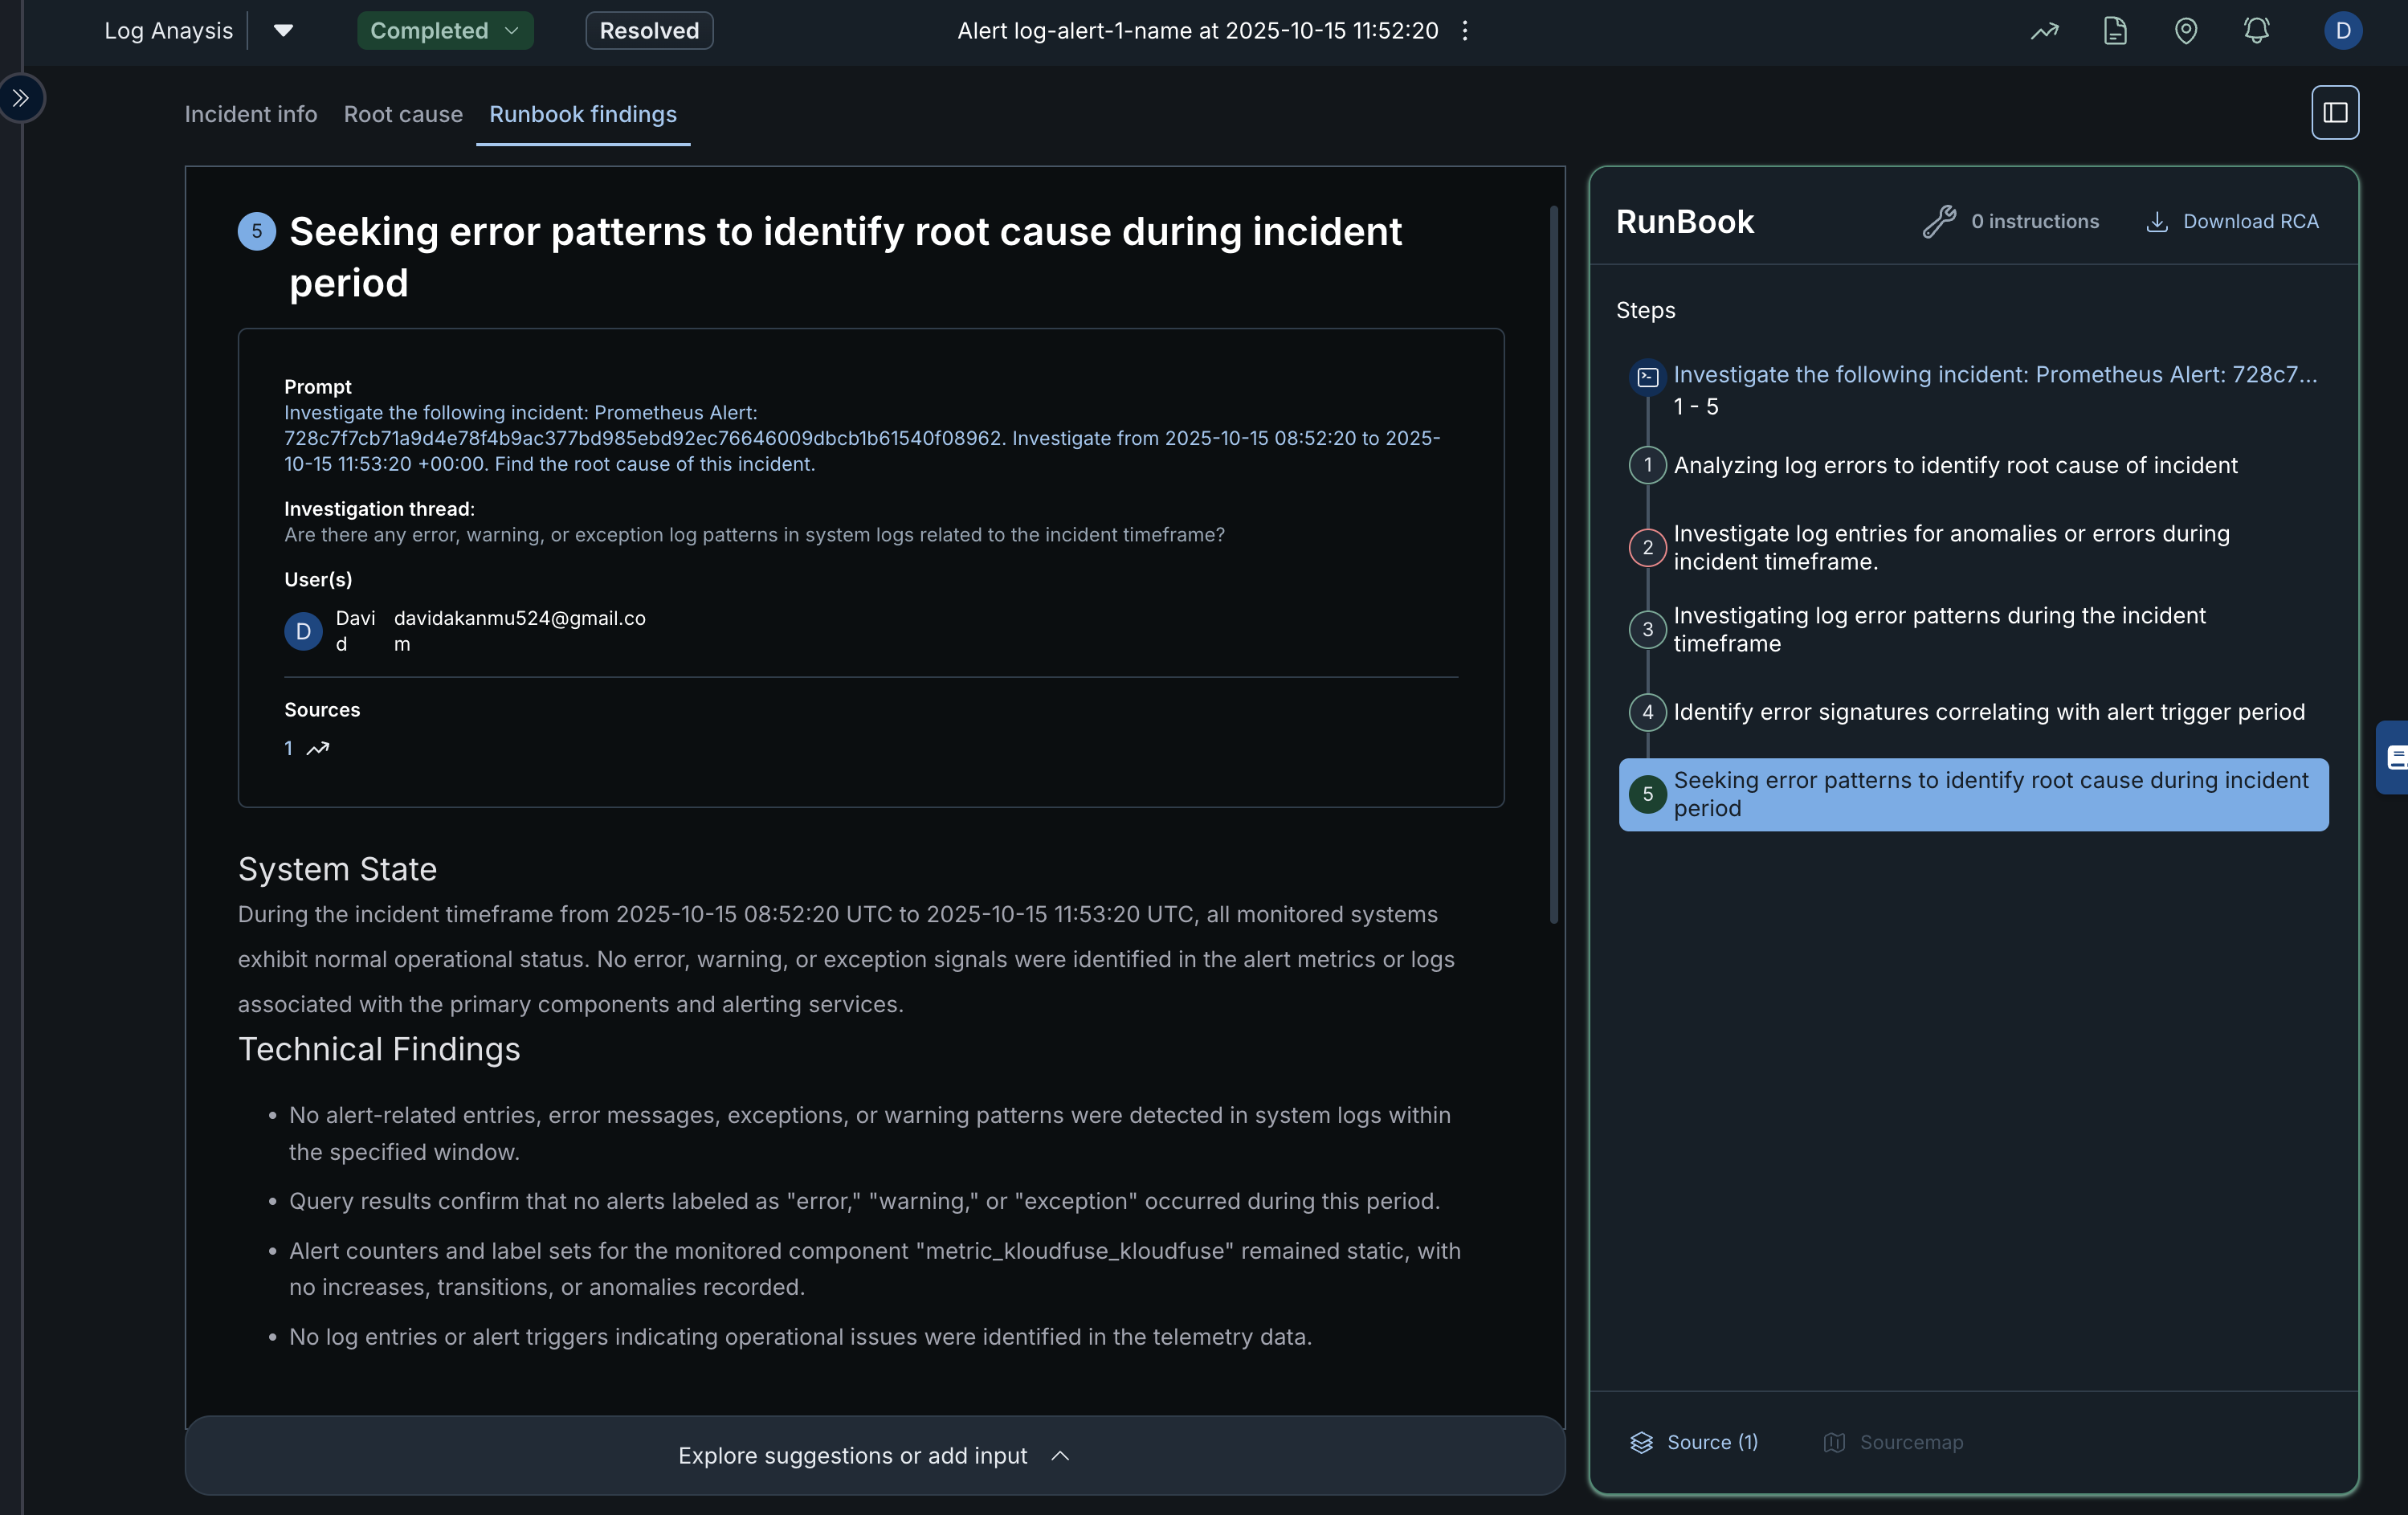
Runbook Findings
This section provides a detailed overview of the Runbook Findings for a completed or resolved incident investigation. It summarizes the analysis process, findings, and steps followed to identify the root cause of the issue.
Key Sections
-
Incident Information Panel (Left Side) Displays details about the investigation step currently being viewed.
- Step Title – Indicates the current step, such as “Seeking error patterns to identify root cause during incident period.”
- Prompt – Describes the specific task or question being investigated. In this case, the system is instructed to analyze Prometheus alert logs within a given timeframe to find the root cause.
- Investigation Thread – Lists guiding questions or prompts used during the log analysis.
- User(s) – Shows the user(s) assigned to or involved in the investigation.
- Sources – Displays linked data sources or monitoring connections used for analysis.
- System State and Technical Findings – Summarize what was discovered during the analysis. This includes operational status, alerts, and log details. In this example, no error, warning, or exception signals were detected, indicating normal system behavior during the incident window.
-
RunBook Panel (Right Side) Provides a structured breakdown of all investigation steps. Each step represents a sequential part of the root cause analysis process.
-
Steps 1–5 show the flow of the investigation, from analyzing log errors to identifying root causes.
-
The highlighted step (Step 5) indicates the stage currently being reviewed.
-
The Download RCA button allows exporting the Root Cause Analysis report for documentation or audit purposes.
-
The Runbook Findings view allows developers and engineers to trace how an incident was analyzed and resolved. It offers visibility into log patterns, system state, and the analytical reasoning behind incident closure, helping teams build transparency and improve future troubleshooting efficiency.
-
-
Recent investigations
The Recent Investigations panel provides an overview of the latest alert investigations within the monitoring dashboard. It helps users track and review the progress of both automated and manually triggered incident analyses.
Investigations are Structured processes for analyzing and resolving incidents or suspicious activities. It gathers context, evidence, and actions taken so you can identify root causes and implement long-term fixes.
The demo below shows a walk through of the Recent investigations interface.
You can also use the guide below to explore Recent investigations on your project dashboard
-
The Filter feature allows you to find incidents and alerts based on connection source (e.g Datadog, AWS etc.) and platform priority.
Key Features
-
Trigger Filters (Automated / User-initiated) These filters allow you to view investigations based on how they were initiated:
- Automated – Triggered automatically by the monitoring system when an alert condition is met.
- User-initiated – Started manually by a user to analyze specific incidents.
-
Search Bar Enables you to quickly find a particular incident by name, alert type, or keyword.
-
Investigation Cards contains summary of incidents and alerts that have been recently investigated. Each card represents a single investigation and includes the following details:
-
Title – The name or description of the incident being analyzed.
-
Trigger Type – Shows whether the investigation was automated or manually initiated.
-
Priority Level – Displays the severity of the alert (e.g., Sev1, Sev4).
-
Status Badge – Indicates the investigation’s current state (e.g., Completed).
-
Created / Updated Timestamps – Provide a timeline for when the investigation started and last received updates.
-
Open Button – Opens the detailed view of the investigation for further analysis.
-
You can click on the cards to view the root cause.
-
-
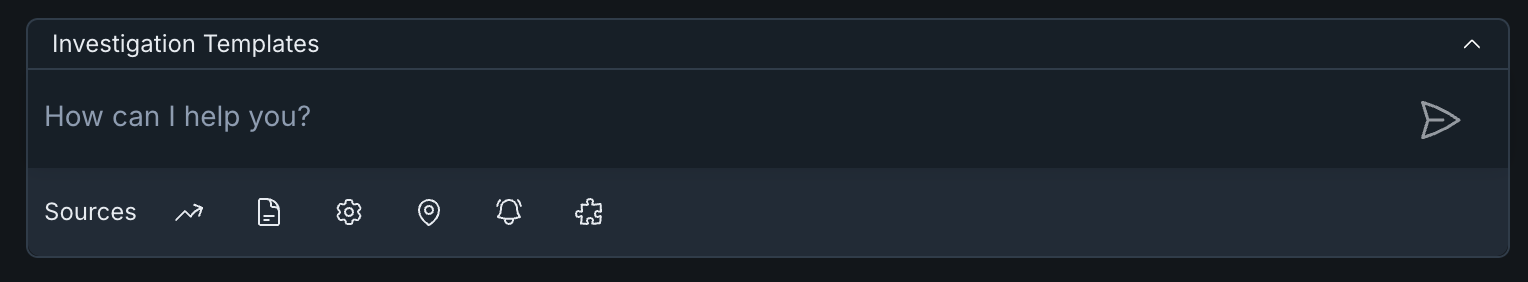
Investigation Templates
The Investigation Templates section provides an interactive interface that helps you initiate automated incident investigations using telemetry data. It allows users to describe what they want to analyze and select relevant data types for deeper inspection.
Interface Overview
-
Input Box At the top of the section is a text field labeled “How can I help you?”. This field allows you to type a natural-language query or describe the issue you want to investigate. For example, you can enter a prompt like:
“Find the root cause of increased latency in the API service.”
-
Telemetry Options Below the input box, you’ll find several telemetry icons representing different data sources or monitoring types. Each icon corresponds to a specific category of telemetry data:
- Sources – Displays integrated data connections or platforms.
- Metric – Provides numerical performance indicators such as CPU, memory, or latency metrics.
- Log – Gives access to system and application log entries.
- Config – Shows configuration or deployment change records.
- Trace – Displays distributed tracing data across services.
- Alarm – Lists alert and notification events triggered during incidents.
- Generic – Represents custom or unspecified telemetry inputs.
How It Works
- Type your investigation query in the “How can I help you?” input box.
- Select one or more telemetry types based on the kind of data you want the system to analyze.
- Click the Send (paper plane) icon to initiate the investigation.
The system then processes your input, retrieves relevant telemetry data from the selected sources, and generates findings or recommendations based on the data correlation.
To learn more about each icon type, navigate to session overview
-